Aug 31, 2026
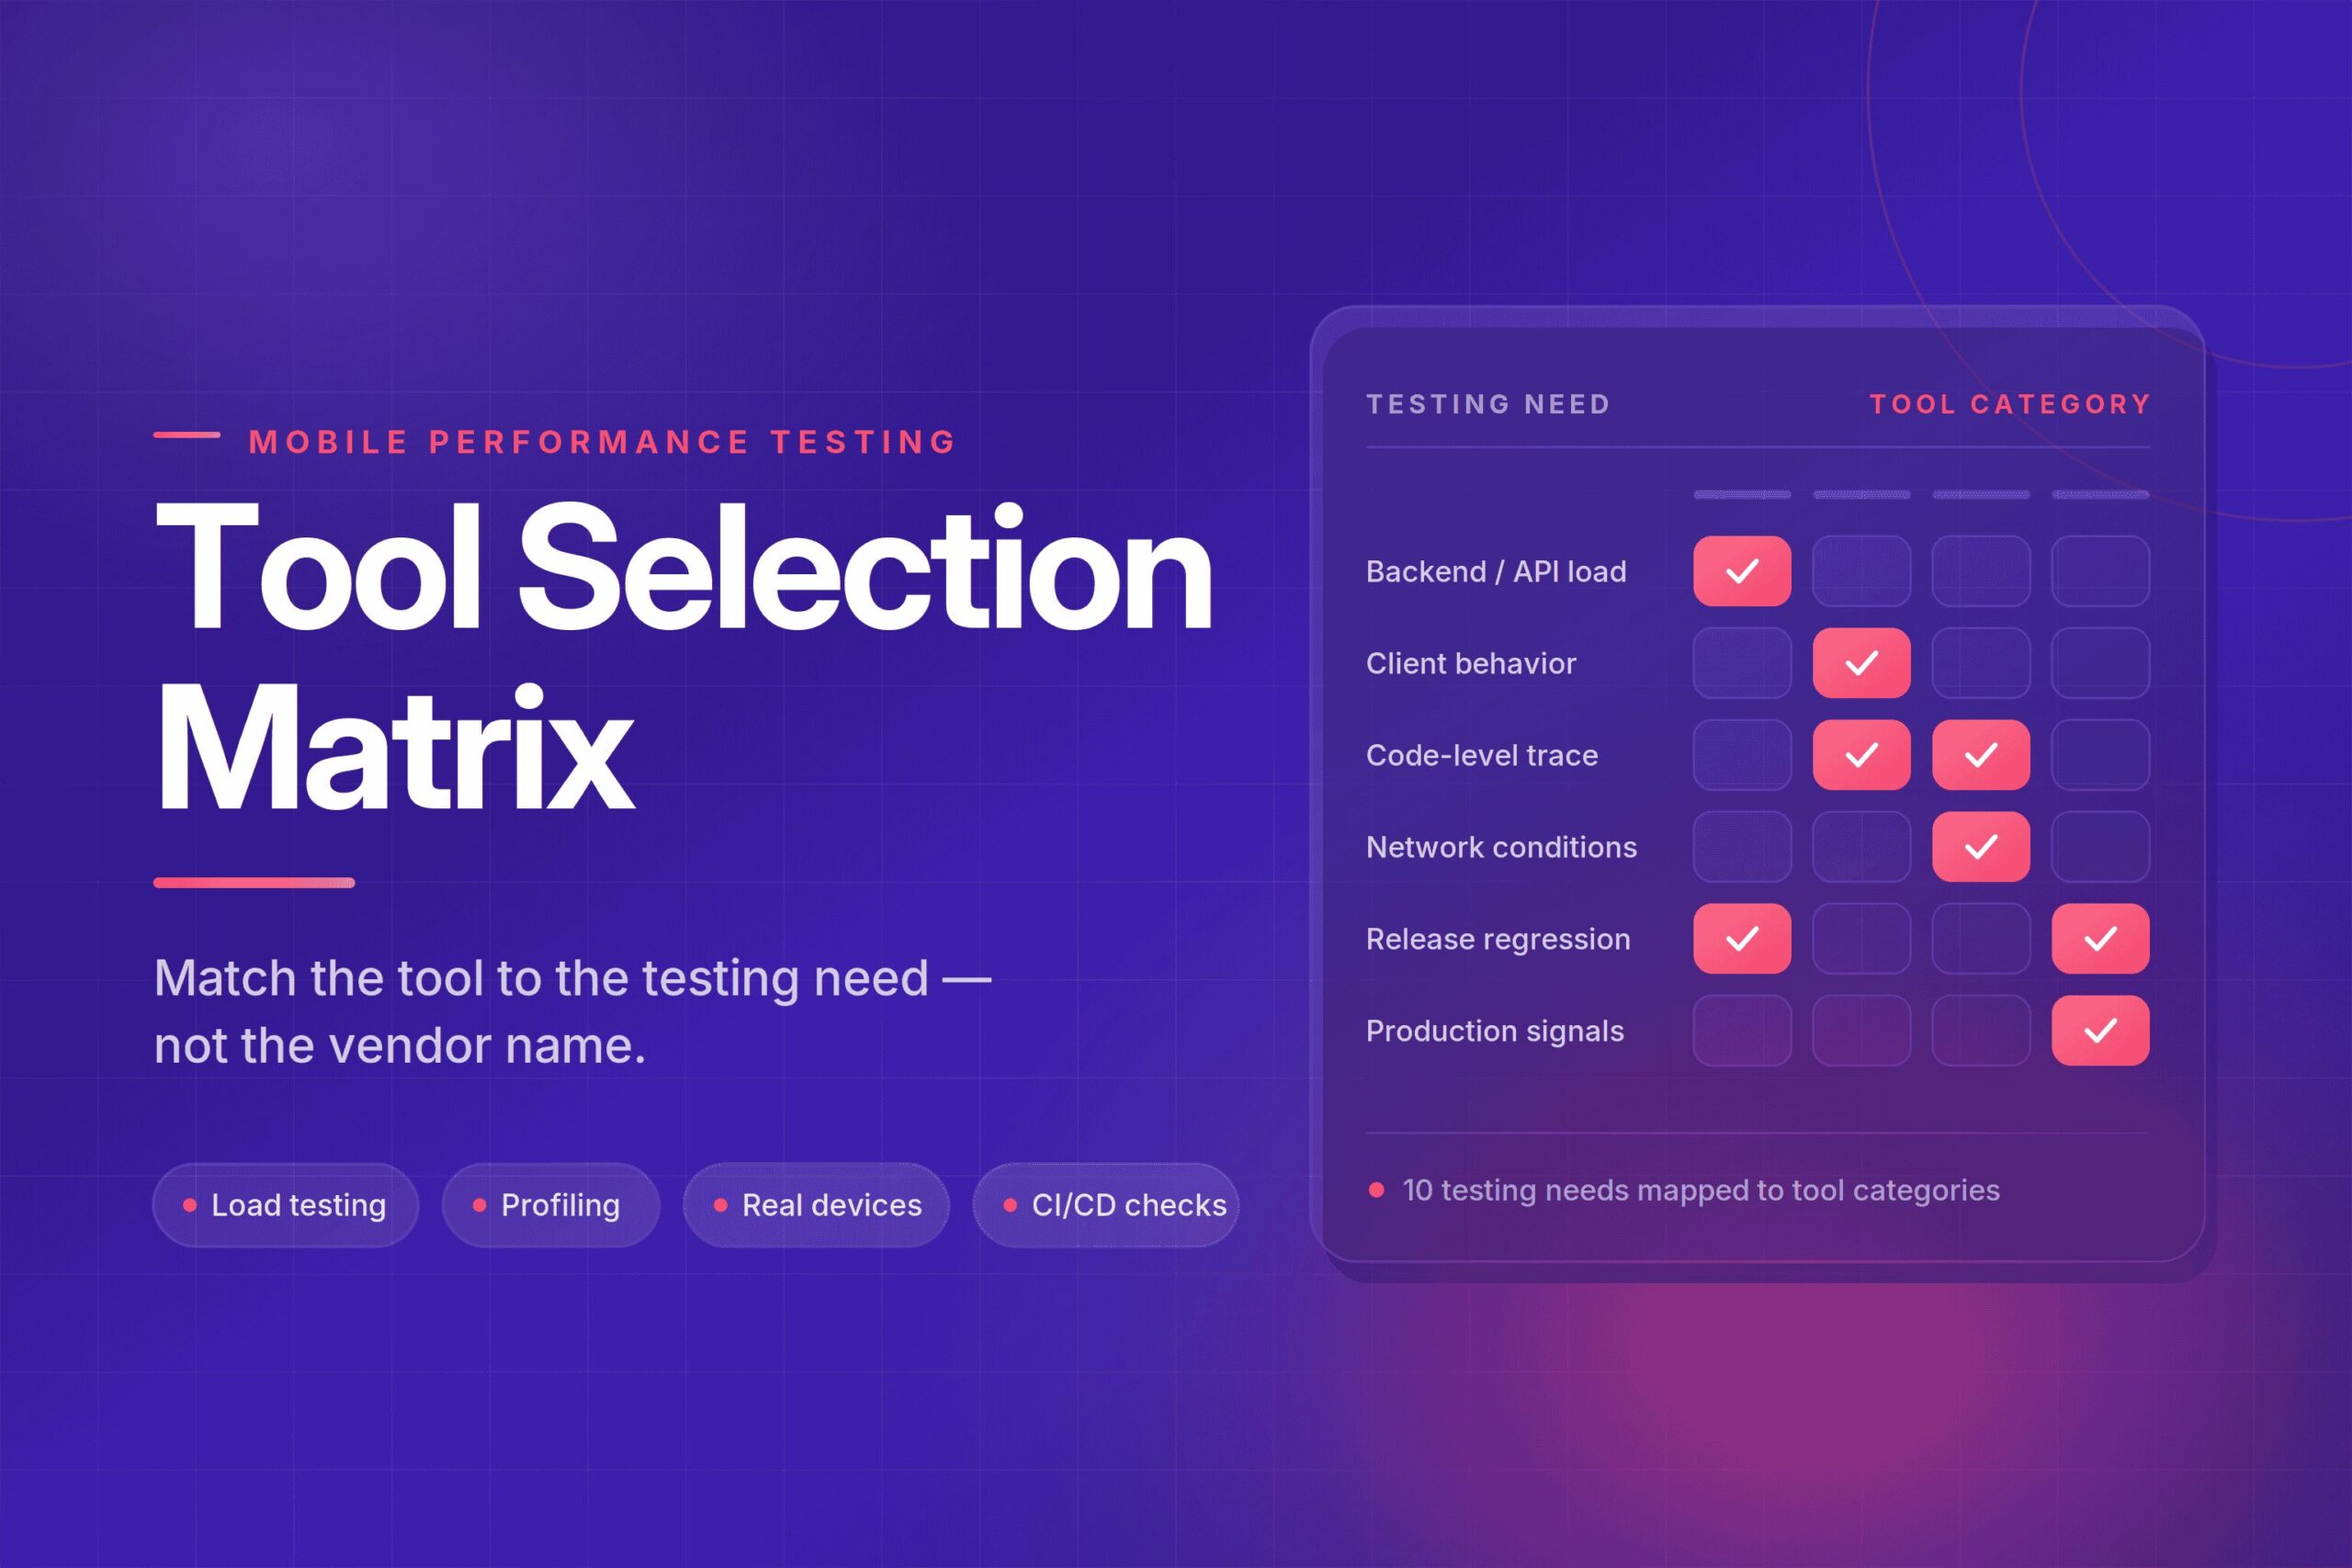
Mobile Performance Testing Tool Selection Matrix: Match the Tool to the Testing Need
Tiffany Smith
Read More
After months of planning, development, design decisions, and release conversations, the app is finally ready to test. Then another question appears: which tools should the team actually use?
For many teams, that question carries a financial decision. Can free or open-source tools provide enough performance signal for the work in front of the team? Is it time to invest in a paid or managed platform? Which parts of the workflow can be validated now, and which gaps will require more infrastructure, support, or scale?
Those questions are practical, but they can also flatten the conversation into “free vs. paid.” That framing is not always helpful. A free tool is not automatically a compromise, and a paid tool is not automatically the better choice. The better question is: what can this tool help the team validate, and what evidence will still be missing?
Free tools can provide real value. The key is understanding what each tool is designed to answer. A free load testing tool can help validate API behavior under demand. A native profiler can help diagnose CPU, memory, rendering, or battery issues. An open-source automation framework can help run repeatable mobile flows. A free real-device testing plan can help teams start validating behavior on physical devices before they commit to a larger testing platform.
That does not mean every team can build a complete mobile performance testing workflow without a paid platform. It also does not mean free tools are only useful for beginners, side projects, or teams without budget. Many experienced developers, testers, and performance engineers use free and open-source tools because they are flexible, extensible, scriptable, and practical.
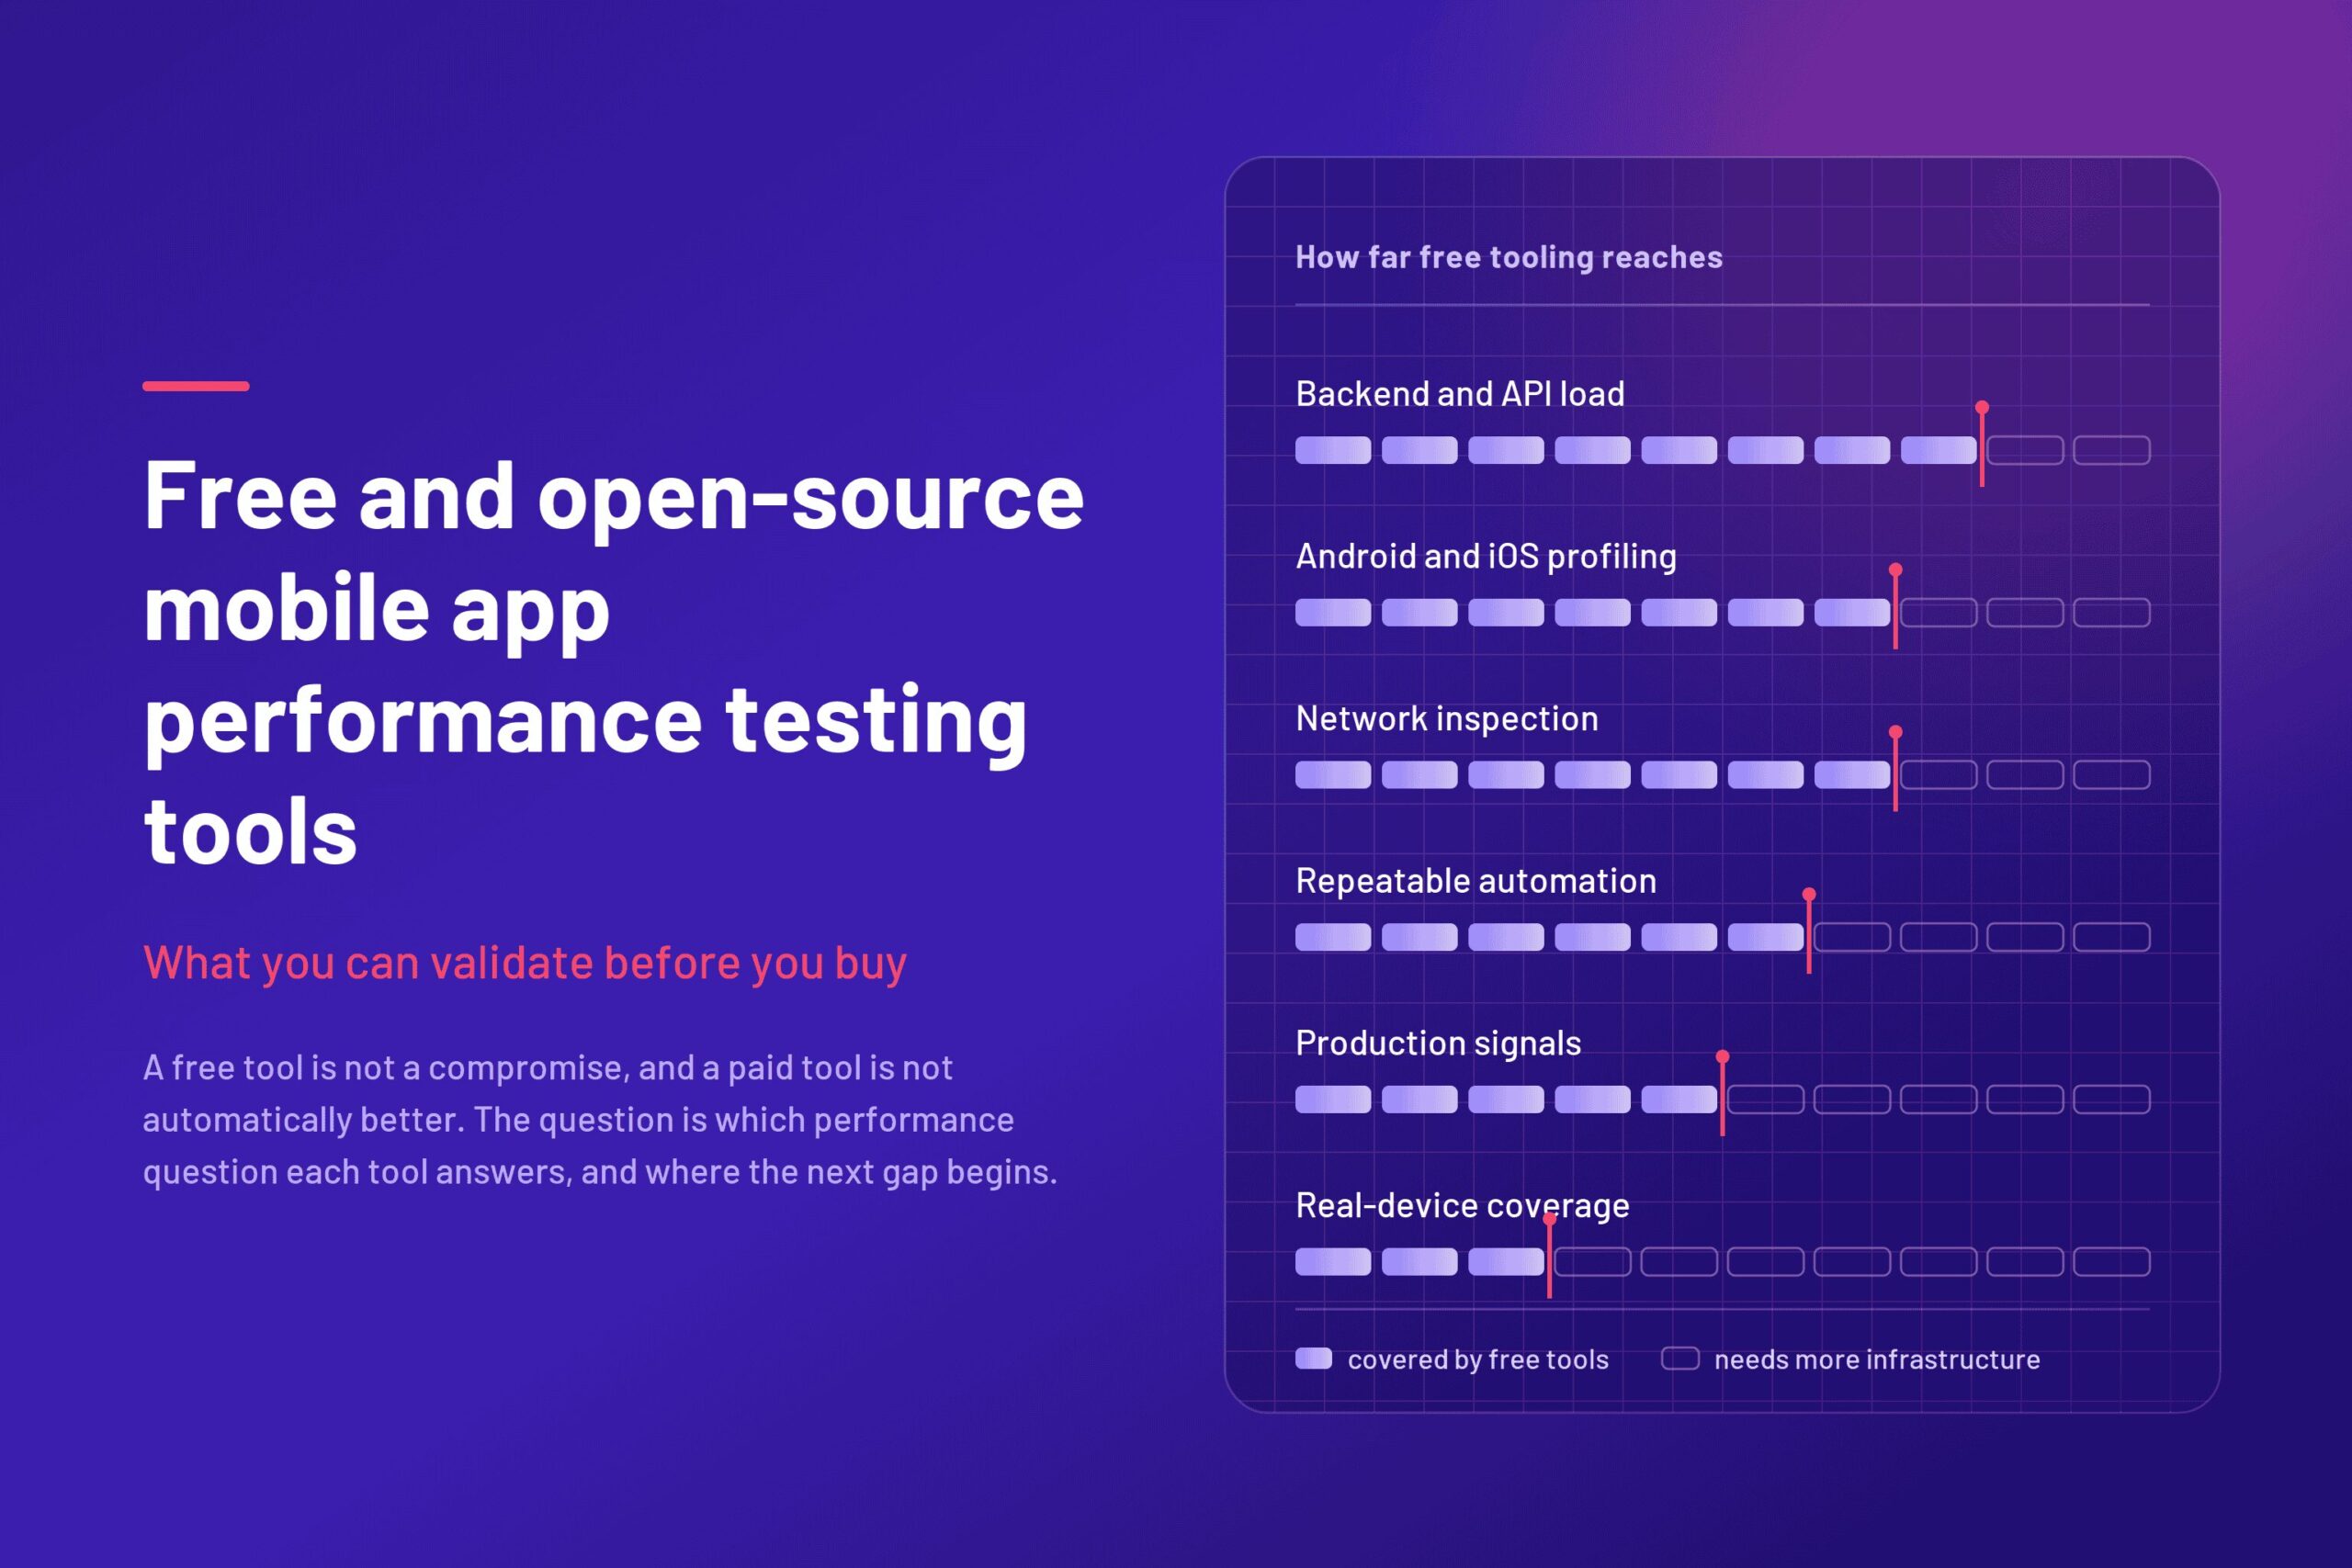
Free and open-source tools can answer real performance questions. The strategic move is knowing which questions they answer well, and where the next gap begins.
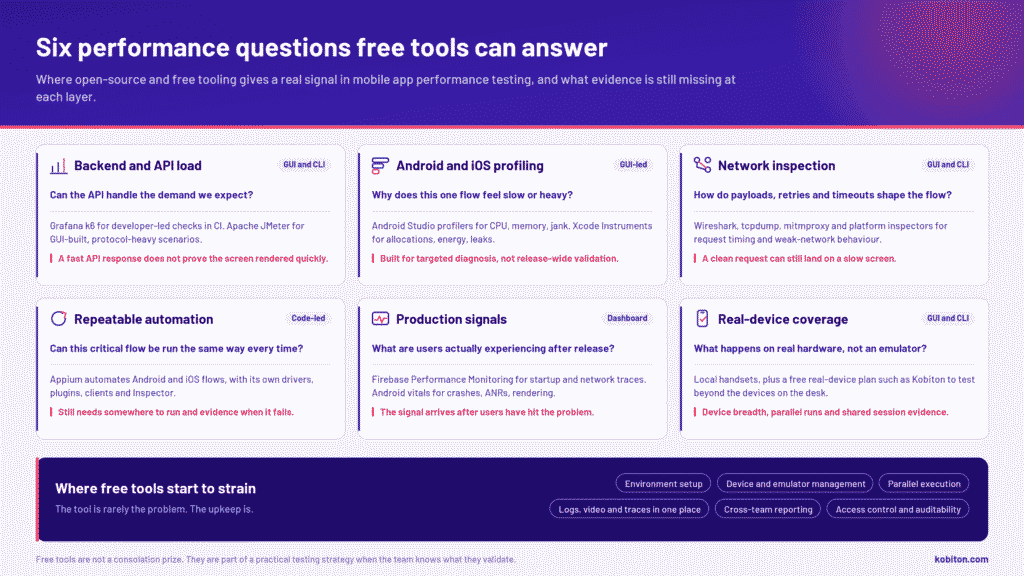
Mobile performance testing covers more than one type of risk. An app might feel slow because of backend latency, client-side rendering, excessive memory use, weak network handling, device-specific behavior, or performance drift between releases.
No single free tool answers all of those questions, but paid tools do not always answer all of them either. The testing strategy should start with the performance question, not the price tag.
For example:
Once the question is clear, the team can choose the tool that produces the right signal.
Tool choice is partly technical and partly practical.
Some teams move faster with GUI-led tools that make setup, recording, inspection, and debugging more visible. Other teams prefer CLI-led or code-driven tools that fit naturally into scripts, version control, CI/CD jobs, and developer workflows.
Neither approach is automatically “better”.
A GUI-led tool can be useful when a team wants a visible workflow, faster setup, or easier inspection. A CLI-led tool can be useful when the team wants repeatable execution, version-controlled test logic, and pipeline integration. Some teams use both.
The best tool is the one the team can use consistently, maintain responsibly, and trust when the results matter.
A practical way to compare free and open-source tools is to separate them by workflow style.
GUI-led tools usually help teams inspect, configure, record, or analyze tests through a visual interface. They can be useful for exploratory work, debugging, onboarding, or workflows where visual feedback helps the team move faster.
CLI-led or code-driven tools usually work well for automation, repeatability, CI/CD, and developer-led testing. They can be easier to version, review, run in pipelines, and connect to other engineering workflows.
This distinction matters because performance testing is not only about measurement. It is also about adoption. A powerful tool that no one wants to maintain will not create lasting value. A simpler tool that fits the team’s habits may produce better results over time.
Start with the performance question, not the price tag. Pick what you need to prove and see which free or open-source tool produces that signal — and where the evidence stops.
Pick a branch to see what it can prove.
No single free tool answers every question — and paid tools don’t always either. Each branch shows the tool to reach for, the signals worth reading, and the evidence you still won’t have.
A fast API response doesn’t prove the screen rendered quickly, the app stayed responsive, or the device handled the flow. Backend numbers stop at the network boundary.
Profilers move you from “the app feels slow” to “here is where it spends time” — on one build, one device, one session. They aren’t built for release validation across many devices or runs.
Deep diagnosis of one flow on the hardware in front of you. It won’t tell you how the same flow behaves on older models, other iOS versions, or under someone else’s network.
Appium automates the flow. It doesn’t decide where tests run, which devices they cover, what evidence gets captured, or how a failure gets reviewed — that part stays yours.
A request can complete cleanly while the app still renders slowly, holds too much memory, or stalls on a lower-spec device. Network data is one layer of the picture.
The trade-off is timing. Production data arrives after users have already hit the problem, so it complements pre-release testing rather than replacing it.
Emulators, simulators and the handful of phones in a drawer only go so far. Real hardware, manufacturer differences, OS versions and live network conditions change the result.
Nowhere — this is the bridge. Keep the free tools where they produce useful signal, and add managed real-device testing when you need device access, shared evidence and less infrastructure to babysit.
Free tools and managed platforms aren’t rivals. Most working toolchains mix them — k6 for the API, a profiler for the flow, Appium for repeatability, real devices for proof.
The goal is not to choose a side. The goal is to choose the workflow the team can sustain.
Backend and API performance tools help teams understand whether services can handle expected or peak demand.
Tools such as Grafana k6 and Apache JMeter are commonly used for this layer of performance testing. They can help teams measure response time, throughput, latency, error rate, and system behavior under load.
k6 is often useful for developer-led performance checks because tests are written in JavaScript and can be run from the command line or integrated into CI/CD workflows. k6 also supports thresholds, which can define pass/fail criteria for performance metrics. [Source: k6 thresholds] [Source: k6 automated performance testing]
JMeter is a mature performance testing tool with broad protocol support and a GUI-driven workflow. It can be useful for teams that need visual test setup, extensive configuration options, or support for more complex enterprise testing scenarios. [Source: Apache JMeter documentation]
These tools can answer important backend and API questions. They do not, by themselves, prove that the mobile app experience is smooth on a physical device. A fast API response does not always mean the screen rendered quickly, the app stayed responsive, or the device handled the flow well.
Native profiling tools help teams understand what is happening inside the app.
For Android, Android Studio profiling tools and Android performance documentation can help teams investigate CPU usage, memory allocation, startup behavior, jank, dropped frames, and rendering issues. These tools are useful when developers need to understand why a specific Android flow feels slow or resource-heavy. [Source: Android jank detection]
For iOS, Xcode Instruments helps teams profile CPU activity, memory allocations, leaks, networking, energy use, responsiveness, and other runtime behavior. Instruments is useful when teams need deeper diagnosis of how an iOS app behaves during a specific flow. [Source: Apple Instruments]
Profilers are powerful because they help teams move from “the app feels slow” to “this is where the app is spending time or resources.” They are especially valuable for developers who need to fix the underlying cause of a performance issue.
Their limitation is scope. Profilers are usually best for targeted diagnosis, not broad release validation across many devices, users, environments, or test runs.
Network inspection tools can help teams understand how requests, responses, latency, payloads, retries, and timeouts affect the mobile experience.
Depending on the workflow, teams may use tools such as Wireshark, tcpdump, mitmproxy, browser developer tools, platform inspection tools, or proxy-based debugging tools. Some are free or open source. Some are paid. The important question is what the team needs to inspect.
Network tools can be useful when testing:
Network inspection is especially useful when a mobile flow depends heavily on backend communication. However, network data is only one part of the performance picture. A request may complete successfully while the app still renders slowly, uses too much memory, or behaves differently on a lower-spec device.
Automation helps teams turn important performance-related flows into repeatable checks.
Appium is a strong example of how open-source tools can provide real value in mobile testing. Teams can use Appium to automate Android and iOS app flows without adopting a proprietary scripting framework. Appium also has an extensible ecosystem of drivers, plugins, clients, and tools such as Appium Inspector. [Source: Appium documentation] [Source: Appium capabilities]
That makes Appium useful when teams want to automate repeatable actions such as launching an app, signing in, navigating a critical flow, interacting with UI elements, or checking whether expected behavior occurs.
Appium is not a complete performance testing environment by itself. It helps automate the flow, but the team still needs to decide where those tests run, which devices they cover, what evidence is captured, and how failures are reviewed.
For a small team, local devices may be enough at first. For broader coverage, teams may need access to more real devices, session artifacts, logs, video, reporting, and parallel execution.
Production monitoring tools help teams understand what users experience after release.
Firebase Performance Monitoring, for example, helps teams understand where app performance can be improved, automatically measure app startup time and HTTP network requests, and identify significant changes in app performance. [Source: Firebase Performance Monitoring]
Android vitals can also help teams monitor quality signals such as crashes, ANRs, slow rendering, and battery-related issues. [Source: Android vitals]
These signals are valuable because pre-release testing cannot catch every real-world condition. Production data can reveal regressions, device-specific problems, network issues, and patterns that were not obvious in test environments.
The trade-off is timing. Production monitoring shows what happened after users encountered the app. It should complement pre-release testing, not replace it.
Free and open-source tools can provide strong performance signal, but they often require more ownership from the team.
Common strain points include:
A free tool may be exactly right for a focused diagnostic task. It may become harder to sustain when the workflow needs broader coverage, repeated execution, shared evidence, or less infrastructure maintenance.
As with any tool, limitations do not make free tools bad. They simply define the work the team still owns.
One of the biggest gaps in a free or local toolchain is real-device access.
A team can learn a lot from local devices, emulators, simulators, profilers, and open-source automation. But mobile performance is affected by real hardware, operating system versions, manufacturer differences, device resources, network conditions, and user interaction patterns.
A free real-device testing option can act as a bridge between local testing and a larger managed device strategy.
Kobiton’s free plan gives teams a way to start testing their own apps on real devices without building a device lab first. That can be useful when a team wants to validate mobile behavior beyond emulators or local devices, but is not ready to move into a broader managed or enterprise setup.
Plan details, usage limits, device access, reservation options, and organization-level features can change, so teams should review the current plan information or contact Kobiton for the latest details.
The value of this bridge is practical. Teams can start with free and open-source tools where they make sense, then add managed real-device testing when they need device access, session evidence, reporting, support, or scale.
Free tools and managed platforms do not have to compete.
A team might use k6 for API performance checks, Android Studio Profiler for Android diagnosis, Xcode Instruments for iOS profiling, Appium for repeatable mobile automation, Firebase Performance Monitoring for production signals, and Kobiton for real-device execution and session evidence.
That kind of toolchain is not unusual. Different tools answer different questions.
The important part is knowing which question each tool answers:
| Testing question | Tool type that may help |
| Can the API handle expected demand? | Load testing tool |
| Why is this Android flow janky? | Android profiler or trace analysis |
| Why is this iOS flow slow or resource-heavy? | Xcode Instruments |
| Can this flow be repeated consistently? | Appium or another automation framework |
| What happens on a real device? | Real-device testing platform |
| What changed after release? | Production monitoring or app vitals |
| What evidence helps the team debug? | Logs, video, screenshots, traces, reports, and session metadata |
A practical performance testing strategy can start free, stay partially free, or combine free and paid tools over time. The right mix depends on the app, the team, the release process, and the evidence needed to make decisions.
Free and open-source tools can provide real value in mobile app performance testing. They can help teams test APIs, profile Android and iOS apps, inspect network behavior, automate repeatable flows, and monitor production signals.
The strategic question is not whether free tools are professional enough. Many are. The strategic question is whether the tool answers the performance question the team needs to resolve.
Start with free tools where they produce useful signal. Add managed real-device testing, reporting, support, infrastructure, or enterprise controls when the workflow needs more coverage and less operational drag.
Free tools are not a consolation prize. They are part of a practical testing strategy when the team knows what they can validate and where the next gap begins.
Yes. Free and open-source tools can provide real performance signal when the team understands what each tool is designed to answer. For example, a load testing tool can help validate API behavior under demand, a native profiler can help diagnose CPU or memory issues, and an automation framework can help run repeatable mobile flows. The value depends on the testing question, not the price of the tool.
Teams often use free or open-source tools to validate early assumptions, reduce licensing costs, customize workflows, support developer-led testing, or add performance checks to existing automation. These tools can be especially useful when the team already has the technical skills to configure, maintain, and interpret the results.
Free tools may be enough when the team has a focused testing need, a manageable device set, and the technical resources to run and maintain the workflow. For example, a team might use free tools to run API load checks, profile an Android or iOS app locally, inspect network behavior, or automate a small set of repeatable flows.
A paid or managed platform can make sense when the team needs broader real-device access, parallel execution, shared reporting, session artifacts, support, enterprise controls, or less infrastructure maintenance. It can also help when testing needs to scale across teams, releases, device models, operating systems, or automated pipelines.
No. Many experienced developers, testers, and performance engineers use free and open-source tools because they are flexible, scriptable, extensible, and widely supported. Open-source does not mean basic. It means the team may have more responsibility for setup, hosting, maintenance, integration, and troubleshooting.
GUI-led tools provide a visual interface for building, running, or inspecting tests. They can be helpful for teams that want a more visible workflow or easier test setup. CLI-led tools are usually stronger for scripting, version control, CI/CD integration, and developer-led automation. Neither approach is automatically better. The right choice depends on how the team works and how repeatable the test needs to be.
Some free tools can support testing on a local real device, but broader real-device coverage usually requires more infrastructure. Teams may need access to multiple device models, operating system versions, logs, videos, network data, and parallel sessions. A free real-device testing plan can help bridge the gap between local testing and a larger managed platform.
Appium is an open-source automation framework that teams can use to automate Android and iOS app flows. It can provide serious value when a team needs repeatable mobile tests without adopting a proprietary scripting framework. Appium is not a complete testing environment by itself, though. Teams still need somewhere to run tests, manage devices, capture evidence, and review failures.
Sometimes free tools cover enough of the workflow, especially for focused testing needs. In other cases, they work best as part of a larger toolchain. A team might use free tools for load testing, profiling, automation, or network inspection, then use a managed platform for real-device coverage, reporting, team workflows, and release validation.
Teams should consider what the tool measures, how it fits their workflow, who will maintain it, whether it supports GUI or CLI usage, how results are stored, whether it integrates with CI/CD, and what evidence it provides when a test fails. A free tool is only useful if the team can run it consistently and trust the results.