Oct 8, 2026
Top Mobile App Testing Tools: An Honest 2026 Comparison
Stephen Penn
Read More
Choosing a mobile performance testing tool is easier when the team starts with the testing need instead of the tool name.
Some tools are built to generate backend load. Some are built to profile CPU, memory, rendering, or battery use. Some help teams validate app behavior on real devices. Others monitor production trends after release. These tools are not interchangeable because they do not answer the same question.
A selection matrix helps teams separate those jobs before they start comparing vendors. The goal is not to find the one tool that does everything. The goal is to choose the tool category, or combination of categories, that gives the team the evidence it needs.
Mobile performance testing covers more than one layer of the app experience. A slow app might have a backend problem, a client-side rendering problem, a memory issue, a network problem, or a device-specific behavior that only appears under certain conditions.
That makes tool selection tricky. A backend load testing tool can show whether APIs handle expected demand, but it cannot show whether the app stayed responsive on a physical device. A native profiler can help developers diagnose CPU or memory issues, but it is not usually the tool a QA team uses to run broad real-device validation before release. A production monitoring tool can show what users experienced after release, but it does not replace pre-release testing.
The matrix keeps the conversation practical. Before comparing products, teams can ask:
This is not a ranking of tools. It is a way to decide which kind of tool belongs in the conversation.
The best tool choice usually starts with a specific performance question.
If the question is, “Can our backend handle expected demand?” the team probably needs a load testing tool. If the question is, “Why is this Android screen janky?” the team probably needs Android profiling or trace analysis. If the question is, “Does this flow still work smoothly on the devices our customers use?” the team probably needs real-device testing. If the question is, “What are users experiencing after release?” the team probably needs production monitoring or app vitals.
Tool selection gets messy when teams start with product names instead of the test purpose. A tool might be excellent for one layer of performance testing and weak for another. That does not make it a bad tool. It means the tool has a job.
Use the question to define that job first.
Mobile performance testing tools usually fall into several broad categories.
Load testing tools help teams understand whether backend systems and APIs can handle expected or peak demand.
Tools such as Apache JMeter and Grafana k6 are commonly used for this layer. JMeter is a mature load testing tool with broad protocol support and a GUI-driven workflow. k6 is more developer-oriented, with JavaScript-based scripting, command-line execution, thresholds, and CI/CD-friendly automation. [Source: Grafana k6 vs. JMeter comparison]
These tools are useful when teams need to evaluate response time, throughput, latency percentiles, error rate, and service behavior under demand.
They do not directly prove that the mobile app experience is smooth on the device. They show whether the backend layer can support the flow.
Native profilers help developers diagnose app performance at the code and platform level.
For Android, Android Studio profiling tools and newer Android performance analysis tools can help investigate CPU usage, memory allocation, startup behavior, jank, dropped frames, and other platform-specific performance issues. These tools are especially useful when a developer needs to understand why a specific Android app flow is slow or resource-heavy. [Source: Android jank detection]
For iOS, Xcode Instruments provides profiling templates for CPU activity, memory allocations, leaks, networking, energy use, responsiveness, and other runtime behavior. Instruments is useful when the team needs deeper diagnosis of what the app is doing on Apple platforms.
[Source: Apple Instruments]
Profilers are strong diagnostic tools. They are not usually the whole performance testing strategy because they focus on investigation and optimization rather than broad coverage, release validation, or cross-device testing at scale.
Real-device testing platforms help teams validate how the app behaves on physical devices.
This category matters when performance results need to reflect device hardware, operating system behavior, touch responsiveness, battery conditions, network radios, manufacturer differences, or hardware-dependent flows. Real-device platforms can also help teams test across device models and OS versions without maintaining every device locally.
Kobiton fits into this category as a real-device testing platform for manual and automated testing. Session Explorer helps teams review session details, interaction logs, network data, and element attributes to troubleshoot issues and validate app behavior. [Source: Kobiton Session Explorer] Kobiton reporting can also help teams review device availability, session summaries, usage, and latency-related reporting. [Source: Kobiton Reporting]
Real-device testing does not replace backend load testing or native profiling. It answers a different question: does the mobile app behave as expected on the devices and conditions users actually rely on?
Production monitoring tools help teams understand what users experience after release.
Firebase Performance Monitoring helps teams understand where app performance can be improved, automatically measure app startup time and HTTP network requests, and identify significant changes in app performance. [Source: Firebase Performance Monitoring] Android vitals also helps teams monitor quality signals such as crashes, ANRs, slow rendering, and battery-related issues.
These tools are useful because pre-release testing cannot catch everything. Production monitoring can reveal trends, regressions, and user-impacting issues in the field.
The limitation is timing. Production monitoring tells the team what has already happened. It should complement pre-release testing, not replace it.
Network tools help teams inspect requests, simulate difficult conditions, or diagnose network behavior.
This category may include tools for packet capture, proxy inspection, request timing, throttling, latency simulation, and payload analysis. Teams use these tools when they need to understand how network behavior affects API calls, media loading, retries, timeouts, offline behavior, sync, or perceived screen load time.
Network tools are useful for targeted investigation. They may not provide the full mobile performance picture on their own, especially when the issue also depends on device hardware, app rendering, or backend behavior.
Automation helps teams run repeatable performance checks as part of a release process.
Tools such as k6 can define thresholds that fail or warn when metrics cross agreed limits. Automated performance checks can also run in CI/CD pipelines, nightly jobs, scheduled runs, or manually triggered release validation. [Source: k6 thresholds] [Source: k6 automated performance testing]
The best candidates for automation are repeatable checks tied to a clear decision: startup checks, API performance checks, critical-flow regression checks, smoke performance tests, threshold-based checks, and release candidate validation.
Not every performance test belongs in every pipeline. Long-running stress, spike, soak, or broad device-matrix tests may be better suited for scheduled runs or high-risk release windows.
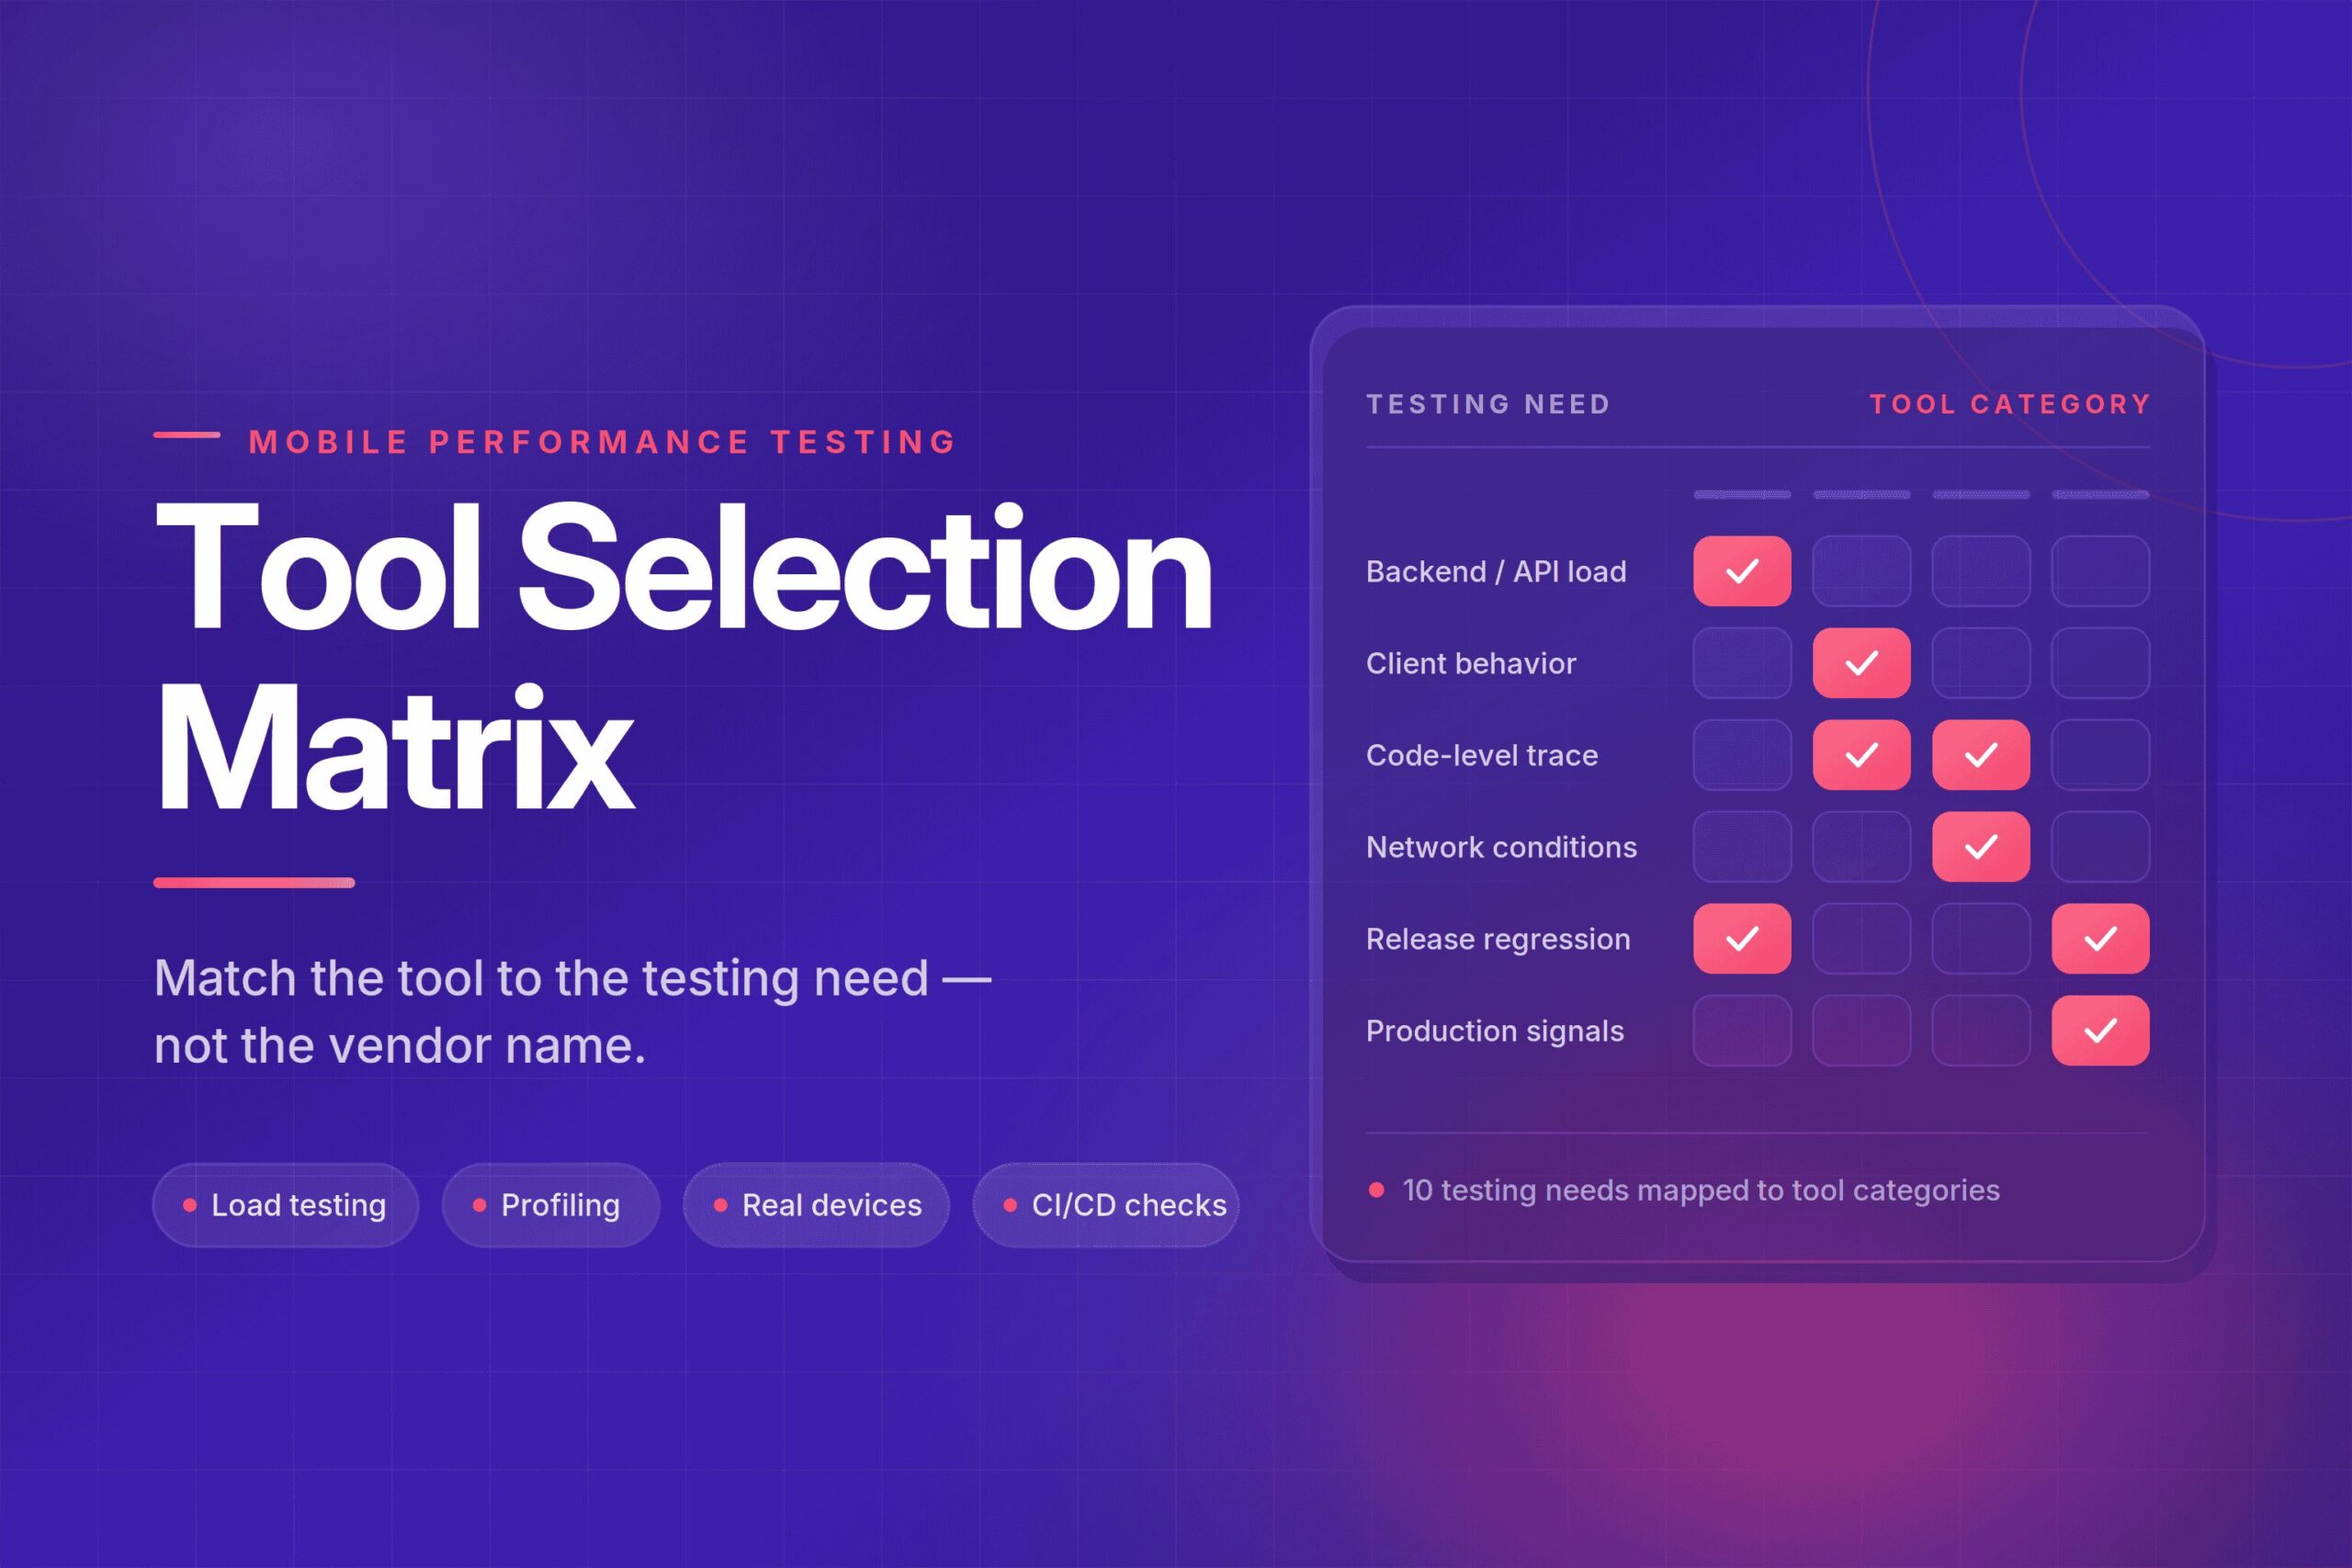
Use this matrix to match the testing need to the tool category that can provide the right evidence.
| Testing need | Tool category | Use when you need to know… | Evidence to look for |
| Backend or API load | Load testing tools | Can services handle expected or peak demand? | Response time, throughput, error rate, latency percentiles, threshold results |
| Mobile client behavior | Real-device testing platforms | Does the app stay usable on real devices? | Session video, logs, device details, app responsiveness, crashes, ANRs, device-specific behavior |
| Code-level diagnosis | Native profilers | What code path is causing CPU, memory, rendering, startup, or battery issues? | CPU traces, memory allocations, rendering data, energy impact, call stacks |
| Device resource usage | Platform performance tools or real-device metrics | How does the app use device resources during critical flows? | CPU, memory, battery, startup time, frame rendering, thermal behavior |
| Network behavior | Network simulation or proxy tools | What happens under latency, packet loss, weak signal, or request inspection? | Request timing, payload details, retries, timeout behavior, packet captures, HAR files |
| Release regression checks | Automation and CI/CD performance checks | Did this release make performance worse? | Baseline comparison, trend changes, threshold failures, build warnings, release-gate results |
| Production behavior | APM, RUM, crash reporting, or platform vitals | What are users experiencing after release? | Crash rate, ANR rate, hang rate, real-user latency, slow screens, production trends |
| Debugging evidence | Session artifacts, logs, traces, and reports | Can the team explain what happened during the test? | Logs, screenshots, video, timestamps, device/OS details, API traces, error details |
| Hardware-dependent flows | Real-device labs or device clouds | Does performance hold up when the flow depends on device hardware? | Camera, GPS, Bluetooth, biometrics, payments, wearables, external hardware behavior |
| Long-session stability | Soak or endurance testing tools plus device monitoring | Does the app degrade over time? | Memory growth, battery drain, CPU trends, crashes, ANRs, slowdowns over extended use |
Start with the testing need, then work across the row.
For example, if the team needs to know whether APIs can support expected traffic, the matrix points toward load testing tools. If the team needs to know whether a checkout flow remains usable on supported Android and iOS devices, the matrix points toward real-device testing platforms. If the team needs to understand why one screen is slow on Android, the matrix points toward Android profiling and trace analysis.
The matrix can also show when one tool category is not enough.
A login performance issue might involve backend latency, mobile client rendering, network retries, and device-specific behavior. In that case, the team may need API testing, real-device validation, and session evidence to understand the full issue.
A streaming performance issue might involve playback startup time, network transitions, device battery use, and long-session stability. That may require real-device testing, network simulation, device metrics, and production monitoring.
A release regression might require automated checks, baseline comparisons, and deeper profiling only if the regression appears.
The matrix is not meant to replace technical judgment. It is meant to keep the first decision clear: choose the tool category based on the question being asked.
Mobile performance testing often requires more than one tool category because the mobile experience crosses multiple layers.
A backend load testing tool can show whether the service is ready for demand. A native profiler can show where the app is spending CPU or memory. A real-device testing platform can show how the flow behaves on supported devices. A production monitoring tool can show what users experience after release.
Those jobs connect, but they are not the same.
In one customer conversation, a team described running regular performance tests with JMeter while working toward broader automation and CI/CD maturity. That is a common pattern: one tool may support the current stage of testing, while the team builds toward a more complete workflow.
In another customer conversation, a streaming-app team described a previous automation platform that could take up to 40 hours to run a regression suite. Their target was closer to a few hours, with parallel execution, real-device coverage, and device-level metrics such as battery and performance data. For that team, the tool decision was not only about test type. It was also about feedback time, device coverage, and whether the results arrived early enough to support release decisions.
A mature tool stack usually grows around questions like these:
The right answer may be one tool for a focused need or a combination of tools for a larger performance strategy.
Use the downloadable matrix to compare tool categories before selecting a tool or vendor. The matrix maps testing needs to tool categories, evidence types, and example use cases so teams can decide whether they need load testing, native profiling, real-device testing, production monitoring, network tooling, CI/CD checks, or debugging evidence.
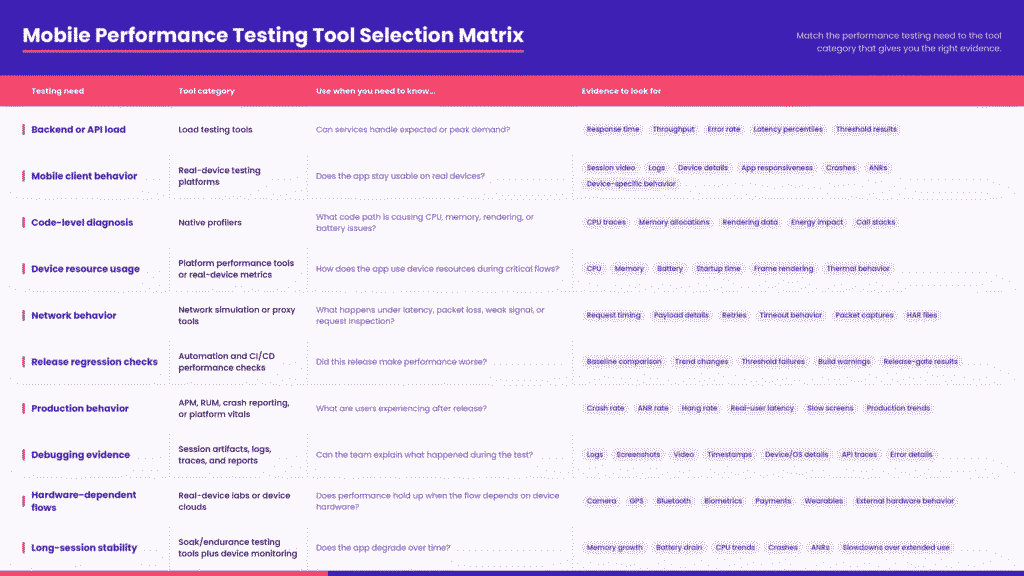
This matrix is useful during tool evaluation, release planning, QA strategy discussions, and performance testing workflow design. It can also help teams avoid comparing tools that were built for different jobs.
There is rarely one best mobile performance testing tool. There is a best tool category for the question the team needs to answer.
Load testing tools help with backend and API demand. Native profilers help diagnose code-level performance issues. Real-device testing platforms help validate the mobile experience on physical devices. Production monitoring tools show what users experience after release. Network tools help investigate request and connection behavior. CI/CD checks help catch regressions earlier.
Start with the testing need, then choose the tool category that can produce the right evidence. That keeps tool selection practical, focused, and tied to the decisions the team actually needs to make.