Mobile users have almost no patience. More than half will walk away from an app that takes longer than about three seconds to become usable, and once someone hits repeated slowdowns, freezes, or battery drain, they rarely give the app a third chance they uninstall it and leave a one-star review on the way out. For any team shipping to the App Store or Google Play, that makes performance a business metric, not just an engineering one.
The catch is that “which tool is best?” doesn’t have a single answer. Mobile performance testing spans everything from the frame rate of a scrolling list to the throughput of the API behind it, and no single tool covers that whole surface well. The right choice depends on what you’re measuring, when in the lifecycle you’re measuring it, and how it plugs into the way your team already ships.
This guide walks through what performance testing actually measures, the types of tests worth running, the metrics that matter, the main categories of tools (with concrete examples in each), a practical process for running tests, a troubleshooting workflow for when things go wrong, and how to automate all of it in CI/CD without slowing releases down. By the end you’ll be able to assemble the combination of tools that fits your app — and see where a real-device platform like Kobiton fits into that picture.
What Mobile Performance Testing Actually Measures
Functional testing asks a simple question: does the feature work? Performance testing asks a harder one: does it work well quickly, smoothly, and reliably when real people use it on real devices under real network conditions?
Concretely, performance testing evaluates an app’s responsiveness, stability, scalability, and resource efficiency. The core signals almost every team should watch include:
- Launch and load time — how long the app takes to open and become interactive, across cold, warm, and hot starts.
- Responsiveness — how the interface holds up when a user taps, scrolls, and switches screens, especially with several interactions happening at once.
- CPU and memory usage — whether the app is efficient or quietly eating the device’s resources and inviting the OS to kill it.
- Battery consumption — a top driver of uninstalls, particularly for apps with background work.
- Network behavior — how the app performs on slow, unstable, or high-latency connections rather than on office Wi-Fi.
- Crash and ANR rates — how often the app crashes or shows “Application Not Responding” (or its iOS equivalent) hangs.
Good performance testing does two things well. First, it reproduces the real world actual devices, real OS versions, throttled networks, and different geographies so results reflect what users experience rather than what a pristine lab shows. Second, it tightens the feedback loop turning a vague complaint like “the app feels laggy” into a specific, traceable regression through dashboards, logs, session replays, and traces. The goal is to catch problems before users feel them.
The Types of Performance Testing
“Performance testing” is really an umbrella over several distinct test types, each answering a different question. A mature strategy uses more than one.
Load testing measures how the app behaves under an expected number of concurrent users. It’s the baseline check that your app and its backend hold up under normal, everyday demand.
Stress testing pushes past normal limits — extreme traffic, constrained device resources — to find the breaking point and, just as importantly, to confirm the app fails and recovers gracefully rather than corrupting data or hanging.
Endurance testing (also called soak testing) keeps the app running for extended periods to surface slow-building problems: memory leaks, gradual battery drain, and performance that degrades the longer a session lasts.
Spike testing simulates a sudden, sharp jump in activity — a marketing push, a flash sale, a viral moment — to verify the app absorbs the surge instead of falling over.
Configuration testing runs the app across different devices, OS versions, screen sizes, and network types to catch performance that’s fine on one setup and terrible on another. Given Android’s OEM fragmentation and the spread of live iOS versions, this is where a lot of real-world issues hide.
The Metrics That Matter (Basic to Advanced)
Choosing a tool is much easier once you know which numbers you actually need. Metrics fall roughly into three layers.
Foundational client metrics are the ones every team should track: app launch time, frame rate (aim for a smooth 60 fps, higher on capable displays), CPU and memory consumption, battery impact, and crash/ANR rates. As a rough target, a cold launch that stays under a couple of seconds and interactions that hold frame rate feel “fast” to users.
Network-level metrics get more granular and often explain problems that client metrics only hint at. These include time-to-interactivity (TTI) — the span from launch until the app is genuinely usable, not just visible — plus DNS resolution time, time to first byte, TCP connection delay, and TLS handshake duration. When an app “feels slow” but the code looks fine, the answer frequently lives here, in the connection setup rather than the rendering.
Experience-level metrics are the hardest to capture but closest to what users perceive: video playback quality, blank-screen time during transitions, and animation smoothness. These often resist simple measurement and lean on screen recording or even machine-learning analysis to quantify, which is one reason free tooling tends to stop short of them.
The practical takeaway: the deeper you go down this list, the fewer tools can measure it, and the more a purpose-built platform earns its place.
The Main Categories of Tools
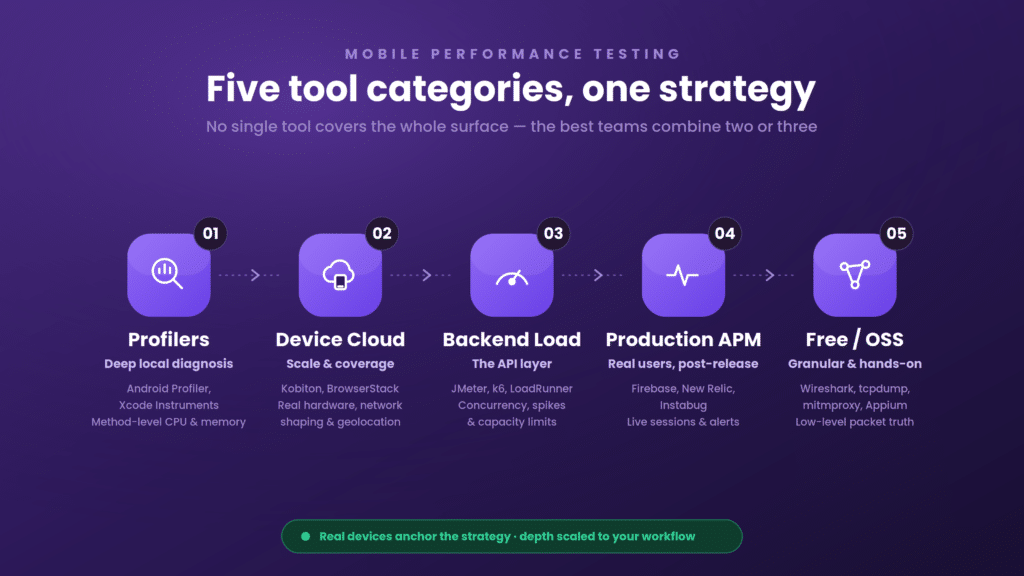
Here’s the mental model that makes tool selection click: performance tools split into categories by what they test and when. Most teams end up combining two or three across these categories rather than betting on one.
1. Native profilers (deep local diagnostics)
These are the authoritative, built-in tools for pinpointing why something is slow at the code level.
- Android Profiler (bundled with Android Studio) reads directly from device hardware counters and offers method-level CPU profiling, heap dumps and allocation tracking for memory, battery-drain attribution, and network request inspection — for both Java/Kotlin and native C++.
- Xcode Instruments is Apple’s equivalent for iOS, with the Time Profiler for CPU hotspots, Allocations and Leaks for memory, Core Animation for rendering and GPU analysis, and network session inspection. It taps system-level APIs unavailable to third-party tools.
Their strength is depth; their limitation is that they’re development-time tools with no CI integration, no cloud devices, and no cross-build trend history. Indispensable for diagnosis, incomplete as a strategy.
2. Real-device cloud platforms (scale and coverage)
Profilers tell you what’s wrong on one device. Real-device clouds tell you how the app behaves across many. You upload a build (APK, AAB, or IPA) and run performance analysis across a large matrix of real Android and iOS devices no physical device lab to buy or maintain.
Kobiton and BrowserStack are the notable options here, providing broad device/OS coverage, network shaping, and geolocation so results reflect real user conditions. The trade-off with generic clouds is that per-run cost can climb at scale and root-cause depth may be shallower than a dedicated profiler. Platforms that pair broad device coverage with AI-assisted analysis and self-healing scripts (as Kobiton does) narrow that gap. Testing on real hardware matters because emulators can’t fully reproduce touch responsiveness, thermal behavior, real battery draw, or carrier-network quirks.
3. Backend load-testing tools (the API layer)
A mobile app is only as fast as the servers behind it. These tools don’t test the client — they hammer your APIs to see how they hold up under concurrent load.
- Apache JMeter — the established open-source workhorse for distributed load testing across HTTP, WebSocket, JDBC, and more. Powerful and free, but scripting-heavy.
- k6 by Grafana — a developer-friendly, JavaScript-based load tester with clean CI integration and threshold-based pass/fail (much like performance budgets). Easier to version-control and maintain than JMeter’s XML plans.
- LoadRunner — a long-standing commercial option built for large-scale simulation with real-time monitoring.
Use these to confirm your backend survives a spike before the launch that causes one.
4. Production monitoring / APM (real users, post-release)
Pre-release tests can’t catch everything. Application Performance Monitoring tools watch real user sessions in production and alert you when things degrade.
- Firebase Performance Monitoring — Google’s free, SDK-embedded option reporting request latency, launch time, and slow/frozen frames from real users. It monitors; it doesn’t load-test or gate builds.
- New Relic Mobile — enterprise APM with crash analytics, distributed tracing, and mobile vitals correlated to user actions. Powerful, with usage-based pricing that can escalate.
- Instabug — combines in-app user feedback with crash reporting and performance monitoring, strong for understanding what real users hit after release.
These are reactive by nature — they tell you what already went wrong in production — so they complement, rather than replace, pre-release testing.
5. Free and open-source network tooling (granular, hands-on)
When you need low-level network truth and don’t mind assembly work, open-source tools deliver:
- tcpdump — captures raw traffic (e.g., DNS resolution on port 53) when the device under test shares your host machine’s network, as with emulators and simulators.
- Wireshark — records detailed packet captures into .pcap files parseable in almost any language, exposing timings like TTFB and handshake duration. It’s GUI-first, which limits CI use, though it can run headless.
- mitmproxy and Charles Proxy — man-in-the-middle proxies for inspecting HTTPS traffic (after configuring the device to trust the proxy’s certificate).
- Network Link Conditioner — simulates constrained network profiles to reproduce slow-connection behavior.
- Appium — beyond automation, can capture basic CPU/memory data and drive screen recording for TTI-style measurements.
The honest caveat, as practitioners note: free network tools often assume emulators, integrate awkwardly with CI, and stop short of experience-level metrics like video quality. They’re excellent for targeted investigation, weak as a continuous, team-scale solution.
Quick comparison
| Category | Example tools | Tests client? | Tests API? | Real devices | CI/CD fit | Best for |
| Native profilers | Android Profiler, Xcode Instruments | Yes | No | Local only | No | Deep local root-cause diagnosis |
| Real-device cloud | Kobiton, BrowserStack | Yes | No | Cloud + on-prem | Yes | Scale, coverage, real-world conditions |
| Backend load testing | JMeter, k6, LoadRunner | No | Yes | N/A | Yes | Validating API capacity |
| Production APM | Firebase, New Relic, Instabug | Production | Partial | Real users | Partial | Post-release monitoring |
| Free/OSS network | Wireshark, tcpdump, mitmproxy, Appium | Partial | Partial | Mostly virtual | Weak | Granular, hands-on investigation |
Real Devices vs. Emulators
Emulators and simulators are cheap, fast, and great for early development and quick debugging across many configurations. But they can’t reproduce the things that most affect perceived performance: real CPU and thermal behavior, actual battery consumption, genuine touch responsiveness, GPU rendering on real silicon, and the messiness of live carrier networks.
The pragmatic split: use emulators early, for rapid iteration and broad configuration sweeps, and use real devices for anything where the numbers need to be trusted — final performance benchmarks, battery and memory profiling, and pre-release validation. This is precisely why a real-device cloud is central to a serious performance strategy rather than an optional extra.
How to Choose the Right Tool for Android and iOS
Start with platform coverage, then evaluate depth:
- Real devices over emulators for any result that must reflect reality — non-negotiable given Android OEM diversity and iOS version spread.
- Android specifics — look for CPU/memory/GPU profiling, ANR visibility, network shaping, System Trace support, and compatibility with Gradle and Android Studio pipelines.
- iOS specifics — look for Xcode Instruments integration, energy-impact insight, network link conditioning, and smooth signing/entitlement handling.
- Scalability and concurrency — can you run in parallel across devices and OS versions to shrink cycle time?
- Actionable data — favor session replays, HAR files, device logs, and trend dashboards over one-off snapshots.
- Security and governance — for regulated teams, SSO/SAML, audit trails, and role-based access control matter.
- Total cost of ownership — weigh licensing, device hours, and the engineering time spent maintaining brittle scripts, not just the sticker price.
A useful rule of thumb: the best tool isn’t the one with the longest feature list. It’s the one that gives you accurate signals, automates them, and scales — for your platforms and your workflow.
A Step-by-Step Performance Testing Process
Tools only help inside a repeatable process. A structured run looks like this:
- Define performance criteria. Set explicit targets — launch time, acceptable response times, crash/ANR thresholds, resource ceilings — so “pass” and “fail” are objective.
- Prepare a realistic test environment. Mirror production: multiple real devices, relevant OS versions, and varied network conditions.
- Identify key scenarios. Prioritize the flows that shape the user experience and the business — login, search, checkout, payment.
- Select the right tools. Match tools to app type (native, hybrid, web) and to the metrics you defined in step one.
- Execute the tests. Run load, stress, spike, endurance, and configuration tests, recording metrics throughout.
- Analyze results. Hunt for bottlenecks, leaks, and network issues; separate real regressions from noise.
- Optimize and re-test. Fix with the dev team, then re-run to confirm the fix worked and introduced nothing new.
Note on app types
- Native apps need device-specific profiling — Android Profiler and Xcode Instruments are essential.
- Hybrid apps need cross-platform consistency checks; Appium-based flows help here.
- Mobile web apps lean on load and stress testing (JMeter, k6, LoadRunner) across browsers and networks.
A Troubleshooting Workflow: Diagnose, Isolate, Fix, Prevent
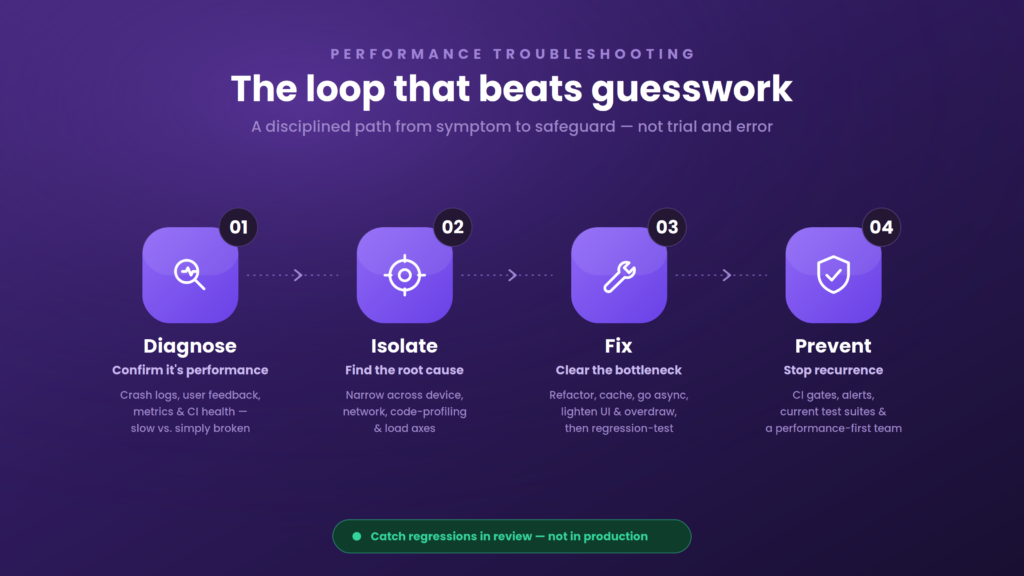
When performance actually breaks, a disciplined loop beats guesswork.
Diagnose. First, confirm it’s a performance issue and not a functional bug — a feature that’s slow but correct is a performance problem, while one that behaves wrongly is a functional one. Monitoring latency and throughput tells them apart. Pull crash logs (via TestFlight or Google Play Console), read user feedback for reproducible complaints, review your performance metrics for anomalies, and check whether the CI pipeline itself is introducing instability.
Isolate the root cause. Narrow it down along four axes: device/OS variability (reproduce across a device matrix), network conditions (throttle with tools like Charles Proxy or Network Link Conditioner), code profiling (find CPU and memory hotspots with the native profilers), and load (use JMeter or k6 to see what only breaks under concurrency — a query that’s fine for five users can collapse at five hundred).
Fix the bottleneck. Typical levers: refactor inefficient code, add caching and streamline API calls, lighten heavy UI and reduce overdraw, pick better data structures, move blocking work to asynchronous operations, and run regression tests so the fix doesn’t break anything else.
Prevent recurrence. Set up continuous monitoring with alerts, bake performance tests into CI/CD, keep test suites current as the app evolves, and cultivate a performance-first mindset on the team so regressions get caught in review rather than in production.
Automating Performance Testing in CI/CD (Without Slowing Releases)
The teams that win treat performance as a continuous gate, not a pre-launch checklist. The trick is keeping it incremental so it never becomes the bottleneck it’s meant to prevent:
- Gate on key KPIs. Define thresholds for launch time, p95 interaction latency, crash/ANR rate, and per-screen frame rate — and fail the build only when those specific limits are breached, so noise doesn’t block merges.
- Parallelize with a device cloud. Run small, targeted checks on every pull request; reserve heavier load and soak tests for overnight runs.
- Shift left with synthetic checks. Put lightweight probes on critical flows (login, search, checkout) to catch regressions the moment they appear.
- Trend over time. Store results so you can spot slow drifts, not just dramatic spikes.
- Close the loop fast. Post results straight back to your version control and chat tools so developers act within minutes.
Done this way, a regression that spikes CPU or pushes memory past its budget fails the pull request the same way a failing unit test would — before it ever reaches a user.
Best Practices
- Test early and often. Start during development, not the week before launch; early issues are cheaper to fix.
- Use real devices for any result you intend to trust.
- Vary network conditions deliberately — 3G, 4G, 5G, Wi-Fi, plus high latency and packet loss.
- Optimize code and assets — trim heavy images, dead scripts, and memory-hungry processes.
- Watch battery and memory closely; both drive uninstalls.
- Make testing continuous by integrating it into CI/CD.
- Benchmark against competitors and industry norms so “good enough” is measured, not assumed.
Developers, not just QA, own part of this: catching bottlenecks while coding, optimizing queries and backend calls, ensuring cross-platform smoothness, and monitoring performance after release.
Where Kobiton Fits
Most of the categories above are point solutions. Kobiton’s role is to be the real-device backbone that ties a performance strategy together and takes it from sporadic profiling to continuous, automated assurance:
- Real-device cloud plus on-prem options — broad Android/OEM and iOS coverage, network shaping, and geolocation for realistic conditions, with a self-hosted path for teams that need it.
- AI-powered automation — test generation, maintenance, and self-healing for critical flows, which cuts the flaky-script maintenance that drags most performance efforts down.
- Enterprise DevOps integration — first-class CI/CD hooks and REST APIs that surface results where engineers already work.
- Actionable insights — unified dashboards with replays, logs, and KPIs so root cause is minutes away, not hours.
- Governance and scale — SSO/SAML, role-based permissions, and workspace controls for larger, regulated organizations.
Paired with native profilers for deep local diagnosis and a load tester like k6 or JMeter for the API layer, a real-device platform gives you the coverage, realism, and automation that turn performance risk into a predictable part of shipping.
Conclusion
There is no single “best” mobile performance testing tool there’s a best combination for your app. Native profilers (Android Profiler, Xcode Instruments) give you depth. Backend load testers (JMeter, k6) protect the API layer. Production APM (Firebase, New Relic, Instabug) watches real users after release. Open-source network tools fill granular gaps. And a real-device cloud like Kobiton supplies the coverage, realism, and CI-ready automation that hold the whole strategy together.
Start from your biggest gap. If you’re discovering regressions from one-star reviews, work backward into pre-release CI gates. If you already test manually before release, automate it. If you’re automated, add AI-driven root-cause analysis to cut triage time. Focus on accurate signals, real devices, deep Android and iOS support, and seamless CI/CD integration — and performance stops being a launch-day gamble and becomes a reliable part of how you deliver.
FAQ
Which metrics matter most for mobile performance testing?
App launch time, frame rate, CPU and memory usage, battery impact, and network latency are the core signals. As rough targets, a cold launch under about two seconds and interactions holding 60 fps feel fast. Teams increasingly enforce these as performance budgets in CI so builds fail automatically when a threshold is crossed.
What’s the difference between load testing and mobile app performance testing?
Load testing measures backend scalability by simulating many concurrent users hitting your APIs. Mobile performance testing focuses on the client-side experience rendering, CPU, memory, battery, and responsiveness on real devices. A complete strategy includes both.
Can I do mobile performance testing for free?
Yes. Android Profiler, Xcode Instruments, JMeter, k6, Firebase Performance Monitoring, and network tools like Wireshark and tcpdump are free or open-source. The trade-off is that free tools usually lack CI orchestration, real-device clouds, historical trend analysis, and AI-assisted root-cause detection.
How is a performance issue different from a functional bug?
A performance issue is about speed and responsiveness — a feature that works but is slow. A functional bug is about incorrect behavior — a feature that doesn’t do what it should. Monitoring latency and throughput helps tell them apart.
Should I test on emulators or real devices?
Both, at different stages. Emulators are fine for early, fast, low-cost iteration and broad configuration checks. Real devices are essential for trustworthy performance, battery, and network results, since emulators can’t fully reproduce real hardware and carrier conditions.
How does AI improve mobile performance testing?
AI adds anomaly detection and automated root-cause analysis — flagging regressions that fall outside normal variance, correlating them to likely causes, and self-healing brittle scripts as the UI changes. That reduces both false alarms and the hours spent triaging failures.
