Is your mobile app performing like a sluggish snail instead of a nimble ninja? User reviews are piling up with complaints about your mobile app crashing, not responding, or being unbearably slow. This is where mobile app performance testing comes into play. It happened to one of our customers—a Fortune 100 telecommunications giant—whose in-store mobile app was so sluggish that customers faced long wait times, leading them to abandon ship and take their business to competitors. In the cutthroat battleground between Verizon, AT&T, T-Mobile, and emerging challengers, our customer was bleeding millions of dollars a month because their in-store mobile app couldn’t keep up. Ouch.
Twenty-five years ago, I was knee-deep in building a wireless billing system for GTE Wireless—a telecommunications giant of its time. I spent two years performance testing and fine-tuning the in-store desktop app that retail workers used to provision services. Through relentless iterations of performance testing and improvements, we slashed the new service order process from over an hour to under eight minutes. Talk about a game-changer.
So fear not! Mobile App Performance Testing may not always steal the spotlight, but it’s the behind-the-scenes champion that can save your app—and your bottom line—from the dreaded one-star review apocalypse. While it shares DNA with performance testing desktop browsers and applications (like we did back at GTE Wireless), mobile app performance testing has its own set of quirks and challenges. Buckle up, because this post is your VIP ticket to mastering mobile app performance testing.
What Is Mobile App Performance Testing, Anyway?
Before we start poking at APIs and throttling networks, let’s get our definition straight. Mobile app performance testing is the practice of measuring how your app behaves—its speed, stability, and resource appetite—under real-world conditions, then fixing whatever you find before your users do. It’s the non-functional cousin of functional testing: nobody’s asking “does the login button work?” Instead we’re asking “does it work in under a second when 50,000 people tap it at once, on a three-year-old phone, on a train, with one bar of signal?”
That last part is what makes it tricky. Performance testing a desktop app—like the wireless billing system I sweated over at GTE Wireless—is hard enough. But mobile adds a carnival of variables: hundreds of device models, a dozen OS versions still in the wild, wildly different chips and battery sizes, and network conditions that swing from 5G to “why is this loading” between one subway stop and the next. Get it right, and your app feels effortless. Get it wrong, and you’re the one-star review nobody reads past.
Know Your App Before You Test It: Native, Hybrid & Web
Not all mobile apps are built the same, and the way an app is built changes where its performance bottlenecks like to hide. Before you write a single test, it pays to know which flavor you’re dealing with.
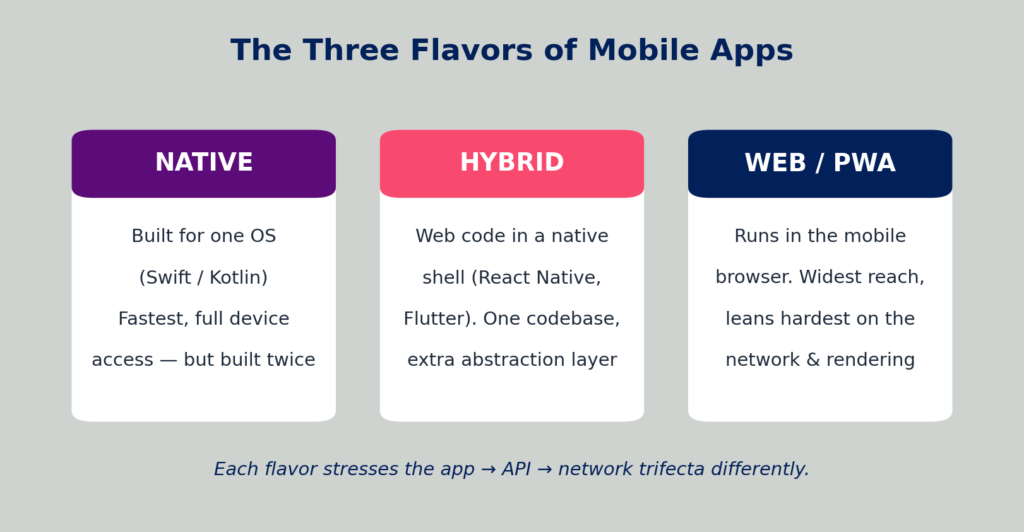
Figure A: The three common mobile app architectures and how each one leans on the app–API–network trifecta.
Native apps are written for a single platform (Swift/Objective-C on iOS, Kotlin/Java on Android). They’re the speed demons—direct access to the device’s hardware and APIs—but you’re effectively building (and performance-testing) the same app twice.
Hybrid and cross-platform apps (React Native, Flutter, Ionic) wrap web-style code in a native shell. One codebase, faster shipping, but that extra abstraction layer is a classic place for jank and memory bloat to creep in.
Web and progressive web apps (PWAs) run in the mobile browser. They reach the widest audience and lean hardest on the two things you least control: the network and the browser’s rendering engine. Whatever your flavor, the trifecta—app, API, network—still applies; the architecture just decides which leg wobbles first.
Why Mobile App Performance Testing Matters (More Than You’d Think)
Remember that Fortune 100 telecom customer from the top of this post—the one bleeding millions a month because their in-store app crawled? That’s not a freak accident. That’s what happens when performance is treated as an afterthought. Here’s why it deserves a seat at the table:
- Users have zero patience. Roughly half of users will uninstall an app over lag, and the vast majority abandon apps that load slowly or crash. Your competitor is one tap away in the same app store.
- It protects revenue, not just ratings. Slow checkout, a frozen “order now” button, a timed-out payment—each one is money walking out the door. Performance is a business metric wearing an engineering costume.
- It guards against the chaos of real devices and networks. Your app will run on hardware and connections you’ve never seen. Performance testing across devices, OS versions, and network speeds is how you keep the experience consistent for everyone, not just the people holding last year’s flagship.
- It catches the silent killers. Battery drain, memory leaks, CPU hogging—these don’t crash the app outright. They just quietly tank your ratings until you wonder what happened. As I learned the hard way at GTE Wireless, the leaks you can’t see are the ones that erode trust.
What is included in Mobile App Performance Testing?
Performance Testing sits under the grand canopy of Non-Functional Testing (NFT), hosting a variety of tests aimed at squeezing every drop of performance out of your app. The ultimate goal? Spotting performance hiccups, crashes, and those dreaded “Do Not Respond” (DNR) moments before your app hits the App Store and your users start staging a digital revolt. Your mobile app experience is a delicate ballet between three main components:
- The Mobile Application: The shiny interface that users tap, swipe, and pinch.
- The Backend API: The powerhouse behind the scenes handling data and logic.
- The Network: The invisible highway connecting your app to the backend.
Performance issues can sneak in anywhere along this trifecta, and tackling them requires a strategic game plan.
Before we dive into the nitty-gritty, let’s dissect what happens when a user interacts with your mobile app. Take the Uber Driver app as a prime example. When a driver gets notified of a potential fare and taps on “Show,” the app springs into action. It kicks off two API calls to Uber’s backend:
- API 1: Calls the “Get Rider Info” endpoint.
- API 2: Calls the “Get Ratings” endpoint.
These calls execute asynchronously and in parallel, zipping over the network to the backend API, which processes them and sends back responses. Once both APIs respond, additional app logic renders the next screen for the user. Think of it as a well-choreographed dance—if one dancer misses a beat, the whole performance can come crashing down. This flow is depicted in Figure 1 (because who doesn’t love a good diagram?).
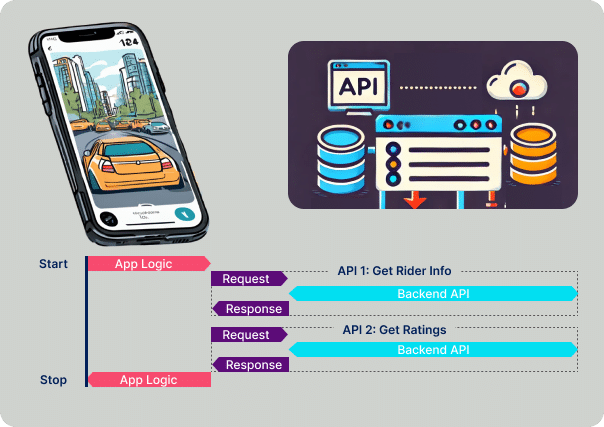
Figure 1: A workflow diagram illustrating the flow of API calls during Mobile App Performance Testing.
Now that we have a detailed understanding of the anatomy of mobile app performance, let’s define what’s included in the three main parts of Mobile App Performance Testing in more detail.
Mobile App Performance Testing of the Front-end App
When evaluating the performance of the mobile app itself—the software running on the user’s device—different factors come into play. Unlike the backend API, which juggles thousands to millions of users, there’s only one instance of the mobile app running on a device per user. So, what matters here is:
- App Response Time: How snappy is your app when responding to user actions?
- Crashes and DNRs: Does your app freeze or crash when the going gets tough?
- Device System Resource Consumption: How much CPU, memory, and battery does your app devour?
App Response Time Testing
Your mobile app’s performance can make or break your brand. According to a survey, 53% of users have uninstalled a mobile app due to issues like lag, while 37% blame the app directly for performance problems. App Response Time measures the interval between when a user takes an action and when the next screen renders. Think of it as the difference between a cheetah’s sprint and a tortoise’s crawl—users definitely prefer the former.
Crashes and DNRs Testing
Sometimes, your app just throws a tantrum. It might freeze (also known as a DNR) or crash, prompting the operating system to restart it. Detecting these moments and pinpointing the stack trace for your developers is crucial. According to a study by UXCam, 90% of users abandon apps due to poor performance. Slow loading times, crashes, and unresponsive features are the unholy trinity of user frustration. iOS and Android have gotten pretty good at auto-recovering from crashes, but testers need to stay sharp by capturing tombstone crash logs in Android and crash logs in iOS.
Device System Resource Testing
Imagine your app is the digital equivalent of a hungry hippo, draining the user’s battery and hogging CPU resources, causing other apps to stutter. Users can easily spot if your app is a resource hog, leading to uninstalls faster than you can say “performance degradation.” Unlike crashes and slow performance, high resource consumption can fly under the radar until your app’s ratings nosedive. Back at GTE Wireless, I learned that sneaky resource leaks were the silent killers of the retail worker’s trust.
Mobile App Performance Testing of the Backend API
The backend API is often the unsung hero—or the villain—in your app’s performance saga. It’s typically the biggest culprit behind slow app response times, not the code running on the mobile device. Here’s where mobile app performance testing starts to resemble performance testing for desktop and browser applications.
API Execution Time Testing
While App Response Time measures the overall time between user action and screen rendering, API Execution Time zeroes in on how long a single API call takes to execute, including various data inputs and conditions. Figure 2 illustrates how we measure the execution time of a single “Get Rider Info” API call. During my days at GTE Wireless, ensuring our backend APIs could handle dynamic loads was like keeping a well-oiled machine running—any hiccup could cascade into major performance issues with the frontend retail desktop application.
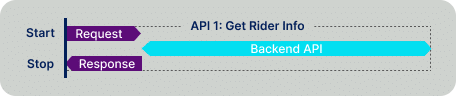
Figure 2: A diagram showcasing how API Execution Time is measured as part of Mobile App Performance Testing.
Load Testing
Load Testing assesses how the API behaves under different loads. For mobile apps, this means evaluating how your app and backend APIs perform under normal and peak user loads. Picture your app during a flash sale or a major product launch—Load Testing ensures your backend can handle the traffic surge without breaking a sweat. Follow the step-by-step instructions below to conduct effective load testing. Figure 3 shows the “Get Rider Info” API call under varying load levels, up to the backend API’s peak capacity.
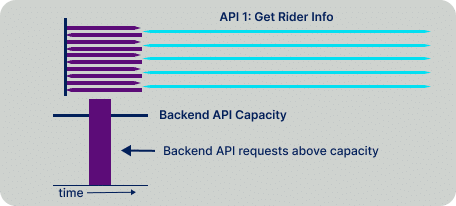
Figure 3: A diagram illustrating the Load Testing process for API calls during Mobile App Performance Testing.
Stress Testing
Stress Testing is all about pushing your app and backend APIs beyond their normal operational capacity to find their breaking points. It’s like seeing how much your app can bench press before it collapses. The goal is to observe how the app and services fail under extreme conditions, providing insights into their robustness and stability. Figure 4 shows the “Get Rider Info” API call under a load that exceeds the backend API’s capacity. At GTE Wireless, stress testing was our way of ensuring our systems could handle the unexpected without going up in flames.
Figure 4: A diagram showcasing the Stress Testing process for API calls during Mobile App Performance Testing.
Spike Testing
Spike Testing subjects the backend APIs to sudden, significant increases in load to see how they handle abrupt changes in user activity. This is crucial for apps that might experience traffic spikes during popular events—think ticketing apps during a major concert or e-commerce apps on Black Friday. Spike Testing ensures your app and backend services can handle these surges without crashing or slowing down to a crawl. Figure 5 depicts a sudden spike in API requests—a scenario every performance tester should be ready for.
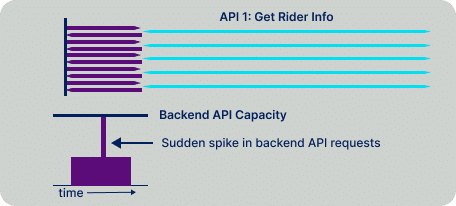
Figure 5: A diagram showcasing how Spike Testing evaluates API performance during sudden load surges in Mobile App Performance Testing.
Soak Testing (aka Endurance Testing)
Soak Testing involves running your backend APIs under significant load for an extended period to identify issues like memory leaks, performance degradation, or resource exhaustion. The goal is to ensure that the backend remains stable over time, not just during short bursts of activity. Figure 6 shows the “Get Rider Info” API being called over extended periods, sometimes stretching into weeks.
Figure 6: A diagram demonstrating how Soak Testing evaluates API performance over extended periods in Mobile App Performance Testing.
Volume Testing
Volume Testing examines how the backend APIs handle large volumes of data by increasing data size, such as the database. This helps assess capacity and identify bottlenecks. Figure 7 illustrates the “Get Rider Info” API call when the backend database contains hundreds of millions of riders. Volume Testing ensures your app can scale gracefully as your user base—and data—grows.
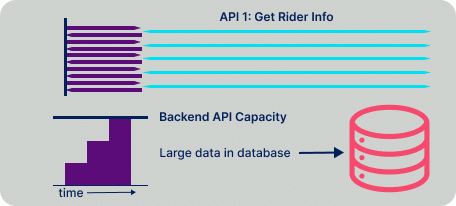
Figure 7: A diagram showing how Volume Testing evaluates API performance with large data volumes in Mobile App Performance Testing.
Mobile App Performance Testing of the Network Communication
Last but certainly not least, we have the network—the invisible thread connecting your mobile app to the backend API. Testing this component is crucial because even the most optimized app and backend can falter if the network connection is unreliable. Here are a few approaches to testing this critical link:
Network Throttle Testing
Network Throttle Testing artificially limits the network bandwidth between the mobile app and the backend API to simulate real-world conditions, like 3G vs. 5G. This helps you understand how your app performs at varying network speeds. After all, your users aren’t all on high-speed Wi-Fi; some are juggling between one bar of signal strength and still trying to order that latte.
Network Packet Loss Testing
Network Packet Loss Testing evaluates how your mobile app handles scenarios where data packets are lost during transmission. This is crucial for apps that rely on real-time data exchange, like messaging or gaming apps. Ensuring your app can gracefully handle packet loss without crashing or degrading the user experience is a hallmark of robust performance testing.
The Performance Metrics & KPIs Worth Tracking
You can’t improve what you don’t measure—and you can’t measure everything, or you’ll drown. Over the years I’ve learned to keep my eyes on a handful of metrics that actually move the needle on user experience. Here are the KPIs I’d put on the dashboard before anything else.
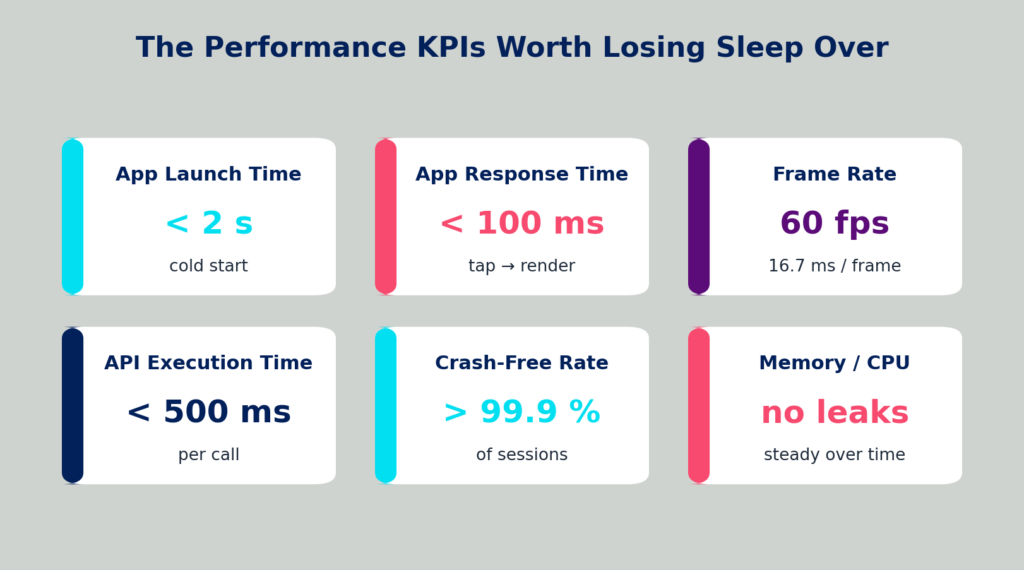
Figure B: The core mobile performance KPIs and the rough thresholds users start to notice.
Think of these as your app’s vital signs. Two of them deserve a closer look, because they trip up more teams than any others: how fast your app starts, and how smoothly it draws to the screen.
App Launch Time (Cold, Warm & Hot Starts)
The very first impression your app makes is how long it takes to open—and not all launches are equal. A cold start happens when the app’s process isn’t running at all and the OS has to build everything from scratch; this is your worst case and the one to optimize hardest. A warm start reuses a process that’s still alive in memory, and a hot start is near-instant because the app was just backgrounded. Users judge you on the cold start, so that’s the number to chase below two seconds.
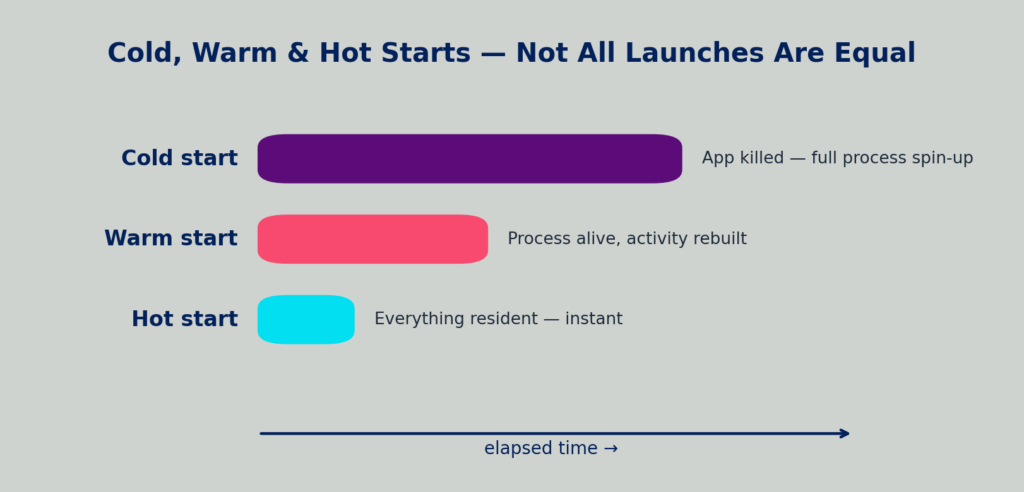
Figure C: Cold, warm, and hot starts—why the same “open the app” action can feel very different.
Frame Rendering & Scrolling Smoothness
Ever scrolled a feed that stutters like a skipping record? That’s jank—frames that miss their deadline. To hit a buttery 60 frames per second, your app has just 16.7 milliseconds to draw each frame. Blow that budget and the user feels it instantly, even if they can’t name it. Tracking dropped frames and render times turns “it feels laggy” into a number you can actually fix.
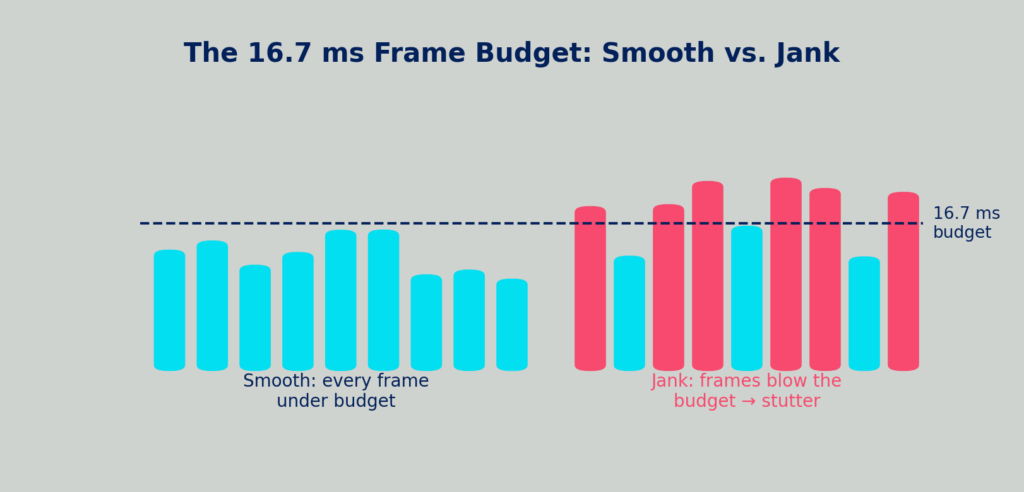
Figure D: The 16.7 ms frame budget. Stay under the line and scrolling is smooth; cross it and you get jank.
How To Do Mobile App Performance Testing?
Ready to roll up your sleeves and dive into Mobile App Performance Testing? Here’s a brief overview of the four-step process you need to follow. If you’re itching to get hands-on and earn your Mobile Performance Testing Certification, enroll in our free course, Mobile Performance Testing with Kobiton and Grafana k6. In this process, you will:
- Capture the network payloads between your mobile application or mobile browser and the backend API.
- Export the HTTP Archive (HAR) file, which contains the network payloads.
- Import the HAR file into Grafana k6 (you can also use other tools like LoadRunner, JMeter, or Neoload).
- Run your performance tests on the backend API while running manual or automated tests on a real device.
Step 1: Capture the Network Payloads
Perform a manual test to capture the network payloads. Kobiton captures the network traffic between the frontend mobile application and the backend API. Each test step contains all the API calls, including request and response payloads. Session Explorer shows each test step and the associated payloads (see Figure 8). Think of it as recording your app’s network chatter for later analysis.
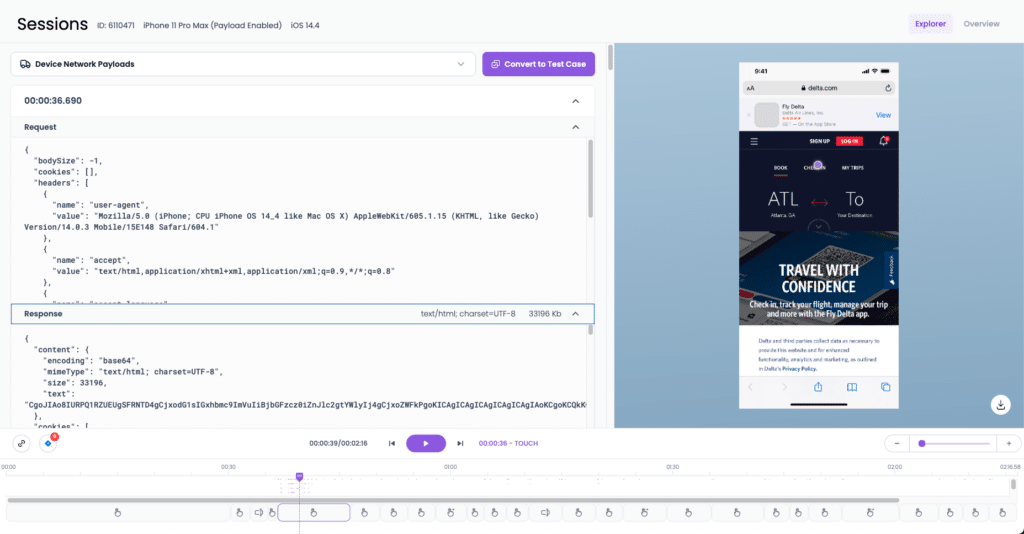
Figure 8: Kobiton’s Session Explorer showcasing captured network payloads during Mobile App Performance Testing.
Step 2: Export the HAR File
Navigate to Session Overview, where you can download the HAR file. This file is a treasure trove containing all the network payloads between your mobile app and the backend API. It’s like the black box recorder in aviation—essential for understanding what went wrong when things don’t go as planned.
Step 3: Import the HAR File
Import the HAR file into a load testing tool like Grafana k6, LoadRunner, JMeter, or Neoload. Once imported, you can tweak virtual user settings, ramp times, and other configuration parameters for your load test. It’s like setting up the stage before a big performance, ensuring everything is in place for a seamless show.
Step 4: Execute Testing
Run your performance tests against the backend API while simultaneously running manual or automated tests against the mobile app or browser. Kobiton automatically captures the front-end response time of each test step using Performance Validations. Whether you’re manually executing test steps or running automation scripts with XCUITest, Espresso, or Appium, Kobiton has your back. Plus, you can leverage Kobiton’s Generative AI to generate an Appium script from the manual session. For those who prefer a no-code approach, Kobiton’s Scriptless Test Automation lets you run tests without writing a single line of code. It’s performance testing made as easy as ordering your favorite takeout—minus the delivery fee.
The Mobile App Performance Testing Toolbox
No single tool covers the whole trifecta—which is exactly why the four-step process above mixes a few of them together. Here’s how the usual suspects map onto the three layers of your app, so you can assemble a stack instead of betting on one silver bullet.
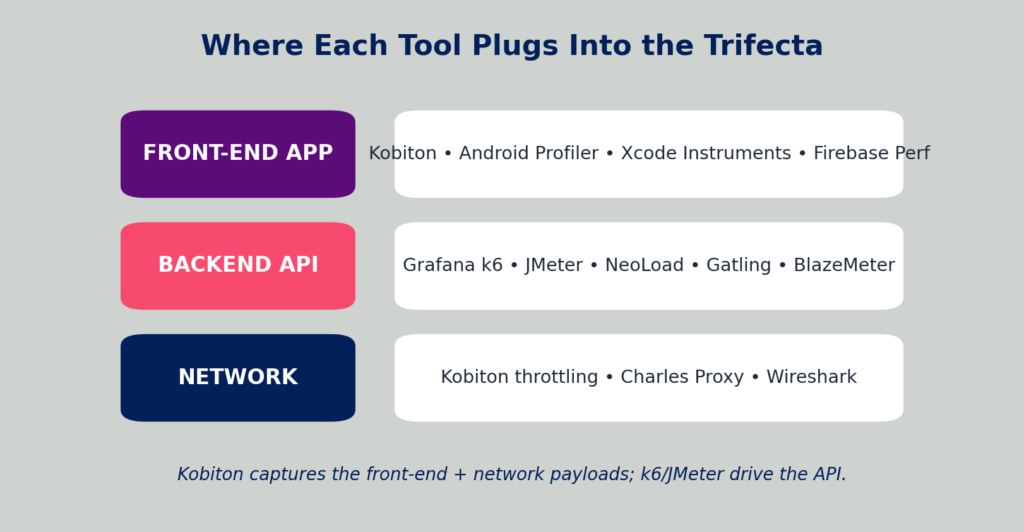
Figure E: Where the popular performance tools plug into the app, API, and network layers.
- Front-end & device: Kobiton for capturing real-device sessions, network payloads, and front-end response times; Android Profiler and Xcode Instruments for CPU, memory, and battery; Firebase Performance Monitoring for production traces.
- Backend & API load: Grafana k6, LoadRunner, Apache JMeter, NeoLoad, Gatling, and BlazeMeter for driving load, stress, spike, and soak tests against your APIs from the HAR file you exported.
- Network: Kobiton’s built-in throttling to simulate 3G/4G/5G, plus Charles Proxy or Wireshark when you need to stare at the raw packets.
My advice, hard-won: pick tools that hand off cleanly to each other. The magic of the HAR-file workflow is that Kobiton captures the real session and k6 (or JMeter, or NeoLoad) replays it as load—no fragile re-scripting in between. A toolbox beats a hammer every time.
Analyzing the Mobile App Performance Testing Results
So, you’ve run your tests. Now what? How do you make sense of all that data without your brain turning into scrambled eggs? Analyzing Mobile App Performance Testing results is both an art and a science. Here’s how to navigate the labyrinth of data and turn it into actionable insights.
Capturing Details of Performance Issues
One pain point I experienced at GTE Wireless—and which was instrumental in shaping Kobiton’s Performance Validations—was not capturing enough information when a performance issue occurred. Developers would struggle to determine the root cause of a slow API call. Without details like CPU usage on the database server, network utilization, external service provider response times, and other critical diagnostics, troubleshooting becomes a wild goose chase. Kobiton’s Session Explorer provides an exhaustive collection of information related to what was happening on the mobile device when the performance issue occurred. Figure 9 shows the Response Time Analysis performed automatically for manual and automation tests conducted on Kobiton.
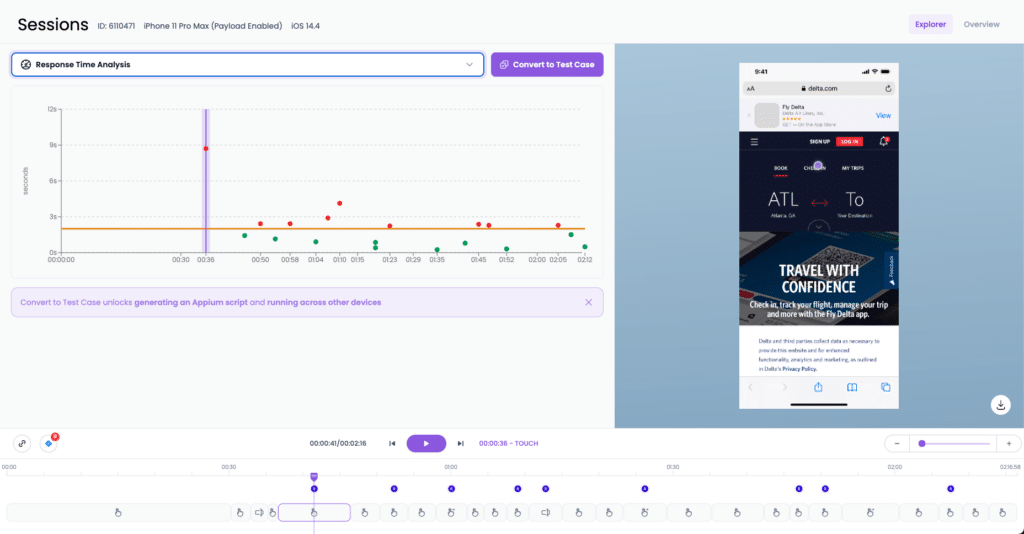
Figure 9: Kobiton’s Session Explorer displaying Response Time Analysis for each test step during Mobile App Performance Testing.
Data Aggregation and Visualization
First things first: aggregate your data. Performance testing tools like Grafana k6, LoadRunner, JMeter, and Neoload are great at collecting vast amounts of data, but raw numbers won’t do you much good. Use dashboards to visualize key metrics like response times, error rates, and resource utilization. Graphs, charts, and heatmaps can help you quickly spot patterns and anomalies. Back at GTE Wireless, I relied heavily on visualization to identify performance bottlenecks in our wireless billing system.
Identifying Bottlenecks
Once your data is visualized, the next step is identifying bottlenecks. Look for spikes in response times, increased error rates, or unusual resource consumption. These indicators point to areas where your app or backend API is struggling. For example, a sudden surge in API response time might indicate a backend server under heavy load or a poorly optimized database query.
Root Cause Analysis
After identifying the bottlenecks, dive deeper into root cause analysis. This involves correlating performance issues with specific components or events. Was there a code change that coincided with the performance drop? Did a third-party service experience downtime? Tools like distributed tracing and log analysis can help you trace the journey of a request through your system, uncovering the exact point of failure. It’s like being a detective, piecing together clues to solve the mystery of the slow app.
Benchmarking and Setting Performance Goals
Establish benchmarks based on your analysis to set realistic performance goals. Benchmarks serve as reference points for future testing and development. For instance, if your current app response time averages 500ms, aim to ensure it doesn’t exceed that in the next iteration. These goals keep your development team focused and provide measurable targets for improvement.
Continuous Monitoring and Iteration
Performance Testing isn’t a one-and-done deal; it’s an ongoing process. Continuously monitor your app’s performance in production using tools like Grafana and Kibana for real-time analytics. Iterate on your testing strategies based on feedback and evolving user requirements. By maintaining a cycle of testing, analysis, and improvement, you ensure your app remains performant and reliable over time. Trust me, the quest for optimal performance is never-ending, but the rewards—happy users and robust apps—are worth the effort.
Prioritizing Performance Improvements
With a wealth of data and insights, the next step is prioritizing performance improvements. Not all issues are created equal—some have a bigger impact on user experience than others. Use a prioritization framework to tackle the most critical issues first. For example, fixing a crash that affects 10% of users should take precedence over optimizing a feature that impacts only 1%. This strategic approach ensures your efforts deliver maximum value.
Utilizing Machine Learning for Predictive Analysis
Advanced performance testing tools are now incorporating machine learning algorithms to predict potential performance issues before they occur. By analyzing historical data, these tools can identify patterns and trends that signal future problems. Implementing predictive analysis helps you stay ahead of the curve, addressing performance issues proactively rather than reactively. Kobiton’s Response Time Validations leverage artificial intelligence to explain the root cause of issues with mobile app performance.
Best Practices for Mobile App Performance Testing
Tools and tests are only as good as the habits around them. After a couple of decades of doing this—sometimes the hard way—here are the practices that consistently separate apps that age gracefully from apps that quietly fall apart.
- Start early, test often. Performance bugs found the week before launch are expensive and morale-crushing. Bake testing into development from sprint one, when fixes are cheap.
- Test on real devices, not just emulators. Emulators are great for quick checks, but they don’t reproduce real thermals, real radios, or real battery behavior. The bug that only shows up on an actual mid-range Android is the bug your users will hit.
- Simulate real-world conditions. Throttle the network, test on older hardware, and run tests with the battery low and other apps competing for resources. Your users aren’t all on Wi-Fi holding a brand-new phone.
- Automate the repetitive parts. Manual testing is perfect for exploration; automation is perfect for catching regressions on every build. Use scriptless or AI-generated automation to cover ground without burning out your team.
- Monitor resource usage continuously. Don’t just watch response times—watch CPU, memory, and battery over long runs. The silent leaks hide there.
- Set performance budgets and SLAs. Agree on numbers up front (“cold start under 2s, API under 500ms”) so “fast enough” stops being a matter of opinion and becomes a pass/fail line.
Common Performance Testing Pitfalls (and How to Dodge Them)
Knowing what to do is half the battle; knowing what trips people up is the other half. These are the mistakes I see most often—and the ones I’ve made myself.
- Relying solely on emulators. They’re convenient and consistent, which is exactly why they lie to you about real-world performance. Always validate on physical devices.
- Ignoring background behavior. Apps don’t run in a vacuum. Test what happens during interruptions—a phone call, a notification storm, the app sitting backgrounded for an hour—because that’s where memory and battery problems surface.
- Skipping older devices and OS versions. Your newest phone hides the problems your users on three-year-old hardware live with daily. Test the long tail.
- Forgetting about network variability. “Works on my Wi-Fi” is not a performance strategy. Packet loss, latency, and bandwidth swings need to be part of the test plan, not an afterthought.
- Not capturing enough diagnostics. This one cost me dearly at GTE Wireless: when an issue fires, you need the full picture—device state, server CPU, third-party response times—or root-causing becomes a wild goose chase. Capture context up front.
Wiring Performance Testing Into Your CI/CD Pipeline
Performance testing shouldn’t be a once-a-release fire drill. The teams that win treat it like any other quality check: automated, continuous, and capable of blocking a bad build. Bolt your performance tests onto your CI/CD pipeline and let the robots stand guard.
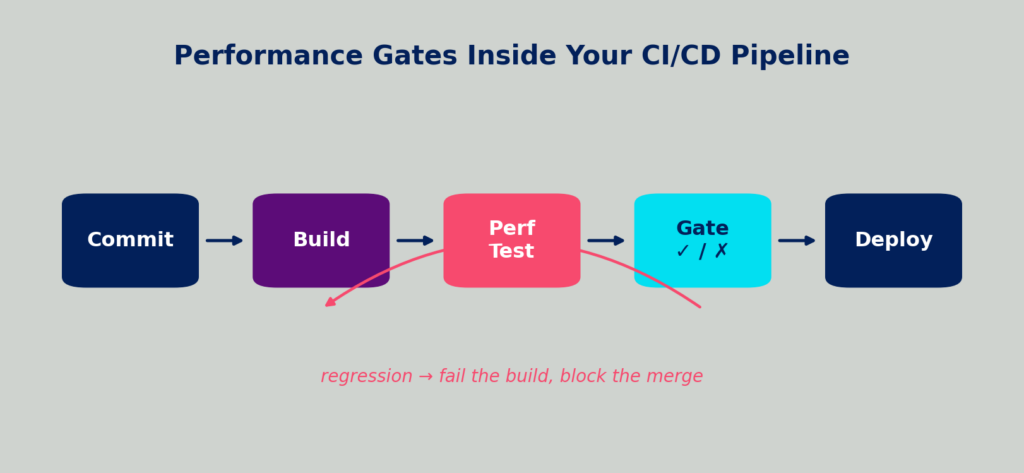
Figure F: A performance gate inside CI/CD—run the test on every build and fail fast on a regression.
- Set automated performance gates. Define thresholds (response time, error rate, resource ceilings) and let the pipeline fail the build when a commit blows past them. No regression sneaks to production unnoticed.
- Monitor for regressions over time. Trend your key metrics build-over-build. A 30ms creep each sprint is invisible day to day and catastrophic over a quarter.
- Report and alert where the team already lives. Pipe results into your CI dashboards and chat tools so performance data lands in front of developers while the code is still fresh in their minds.
Your Mobile App Performance Testing Checklist
Use this as a pre-flight checklist before you call a release “performance-ready.” If you can tick every box, you’ve covered the trifecta from end to end.
- Measured app response time and cold-start launch time against agreed budgets
- Captured crash and DNR logs, with stack traces handed to developers
- Profiled CPU, memory, and battery over a sustained session (no leaks)
- Measured API execution time for each critical call
- Ran load, stress, spike, soak, and volume tests on the backend APIs
- Throttled the network (3G/4G/5G) and simulated packet loss
- Tested on real devices across OS versions—including older, lower-end hardware
- Checked frame rendering and scrolling smoothness against the 60 fps budget
- Integrated performance gates into CI/CD with alerting on regressions
- Set up production monitoring for continuous, real-user performance data
Kobiton’s Free Mobile App Performance Testing Training Course
Feeling like you’ve just skimmed the surface of Mobile App Performance Testing and hungry for more? Well, grab a snack because Kobiton has something special cooked up for you! Introducing the “Mobile Performance Testing with Kobiton and Grafana k6” course—a free training program that not only dives deeper into the intricacies of performance testing but also offers a certification to boost your resume.
Why should you sign up?
- Comprehensive Curriculum: From the basics to advanced techniques, this course covers everything you need to know to master Mobile App Performance Testing.
- Hands-On Experience: Get practical with real-world scenarios and hands-on labs using Kobiton’s robust platform and Grafana k6.
- Certification: Validate your skills and stand out in the crowded job market with a recognized certification upon completion.
Ready to take your performance testing skills to the next level? Sign up for the free course here.
Don’t miss out on this opportunity to transform your approach to Mobile App Performance Testing. Whether you’re a developer, tester, or just a performance enthusiast, this course is designed to equip you with the tools and knowledge to ensure your apps run smoothly and your users stay happy.
Conclusion
Mobile App Performance Testing isn’t just a box to tick in your development checklist—it’s a critical component that can make or break your app’s success. From ensuring snappy response times and preventing crashes to validating backend performance and network reliability, comprehensive performance testing covers all the bases to deliver a seamless user experience.
Drawing from my years of experience in load and performance testing for a wireless rating and billing system at GTE Wireless, I can attest to the importance of meticulous testing and the right tools in maintaining system integrity and user satisfaction. Along with performance validation, Mobile UI Testing plays an important role in ensuring the app interface remains intuitive, responsive, and easy for users to navigate across different devices.
Embrace the principles of Performance Testing, leverage the right tools, and continuously analyze and iterate based on your findings. Your users will thank you with glowing reviews, and your business will thrive as you stay ahead of the competition. So, don’t let your app become the next casualty of poor performance—equip yourself with the knowledge and tools to deliver excellence, one test at a time.
Frequently Asked Questions
How often should mobile app performance testing be conducted?
Ideally, continuously. Run targeted performance checks on every build through your CI/CD pipeline, fuller test cycles before each release, and ongoing monitoring in production. Performance isn’t a one-time gate—it’s a habit. Treat it like brushing your teeth, not like a dentist visit.
What’s the difference between performance testing and load testing?
Load testing is one type of performance testing. Performance testing is the umbrella term for everything that measures speed, stability, and resource use—response time, launch time, crashes, battery, and more. Load testing specifically measures how the system behaves under expected and peak user volume. So all load testing is performance testing, but not all performance testing is load testing.
Can mobile app performance testing be automated?
Absolutely—and it should be for anything repetitive. You can automate API load tests with tools like Grafana k6, LoadRunner or JMeter and automate the front-end side with frameworks like Appium, XCUITest, or Espresso. Kobiton can even generate an Appium script from a manual session, or run scriptless automation if you’d rather not write code at all. Keep manual testing for exploration; automate the regression-catching.
How do mobile OS updates affect app performance?
More than people expect. A new OS version can change how memory is managed, how background processes are throttled, or how the rendering pipeline behaves—sometimes speeding your app up, sometimes quietly slowing it down. Re-run your performance suite against major OS releases (and their betas) so you find out before your users do.
Why test on real devices instead of emulators?
Emulators are fast and consistent, which makes them great for early checks—but they fake the hardware. They can’t reproduce real thermal throttling, real radio behavior, real battery drain, or the quirks of a specific manufacturer’s build of Android. The performance bug that only appears on an actual mid-range device is exactly the one a real-device platform like Kobiton is built to catch.