Mobile users have stopped grading apps on a curve. They compare your checkout flow to the fastest thing on their home screen, not to what’s reasonable for a phone on a congested LTE cell. Research on abandonment has been consistent for over a decade: attention starts leaking at roughly the three-second mark, and by five seconds you’ve lost a large share of the session. Worse, a meaningful fraction of those users don’t come back they leave for a competitor and stay there. Ensuring smooth performance through methods such as mobile app performance testing using LoadRunner can help identify bottlenecks before they impact users.
That makes performance a revenue problem, not a nice-to-have. And it makes the tooling question urgent: how do you actually load test a native mobile app when most performance tools were built for desktop browsers?
LoadRunner (now part of the OpenText portfolio, formerly Micro Focus) is one of the few enterprise-grade answers. This guide walks through how to use it for mobile — the protocols, the recording methods, script hardening, network simulation, and result analysis — and, just as importantly, where LoadRunner’s picture of “performance” ends and real-device testing has to take over.
Latency or bandwidth: what is actually slowing the screen down?
Set the network your users are really on, how many sequential API calls it takes to paint one screen, and how much data comes back. The model shows where the time goes and which fix buys you more.
1. What Mobile Performance Testing Actually Covers
Before touching a tool, get precise about what you’re measuring. Mobile performance splits into two halves that behave very differently:
| Layer | What it measures | Typical tooling |
| Server-side / protocol layer | API response times under concurrent load, throughput, error rates, DB and middleware saturation, scalability limits | LoadRunner, JMeter, NeoLoad, k6 |
| Client-side / device layer | App launch time, screen render and frame rate, CPU/GPU load, memory footprint, battery drain, network payload efficiency, jank and ANRs | Real-device testing platforms, profilers, device instrumentation |
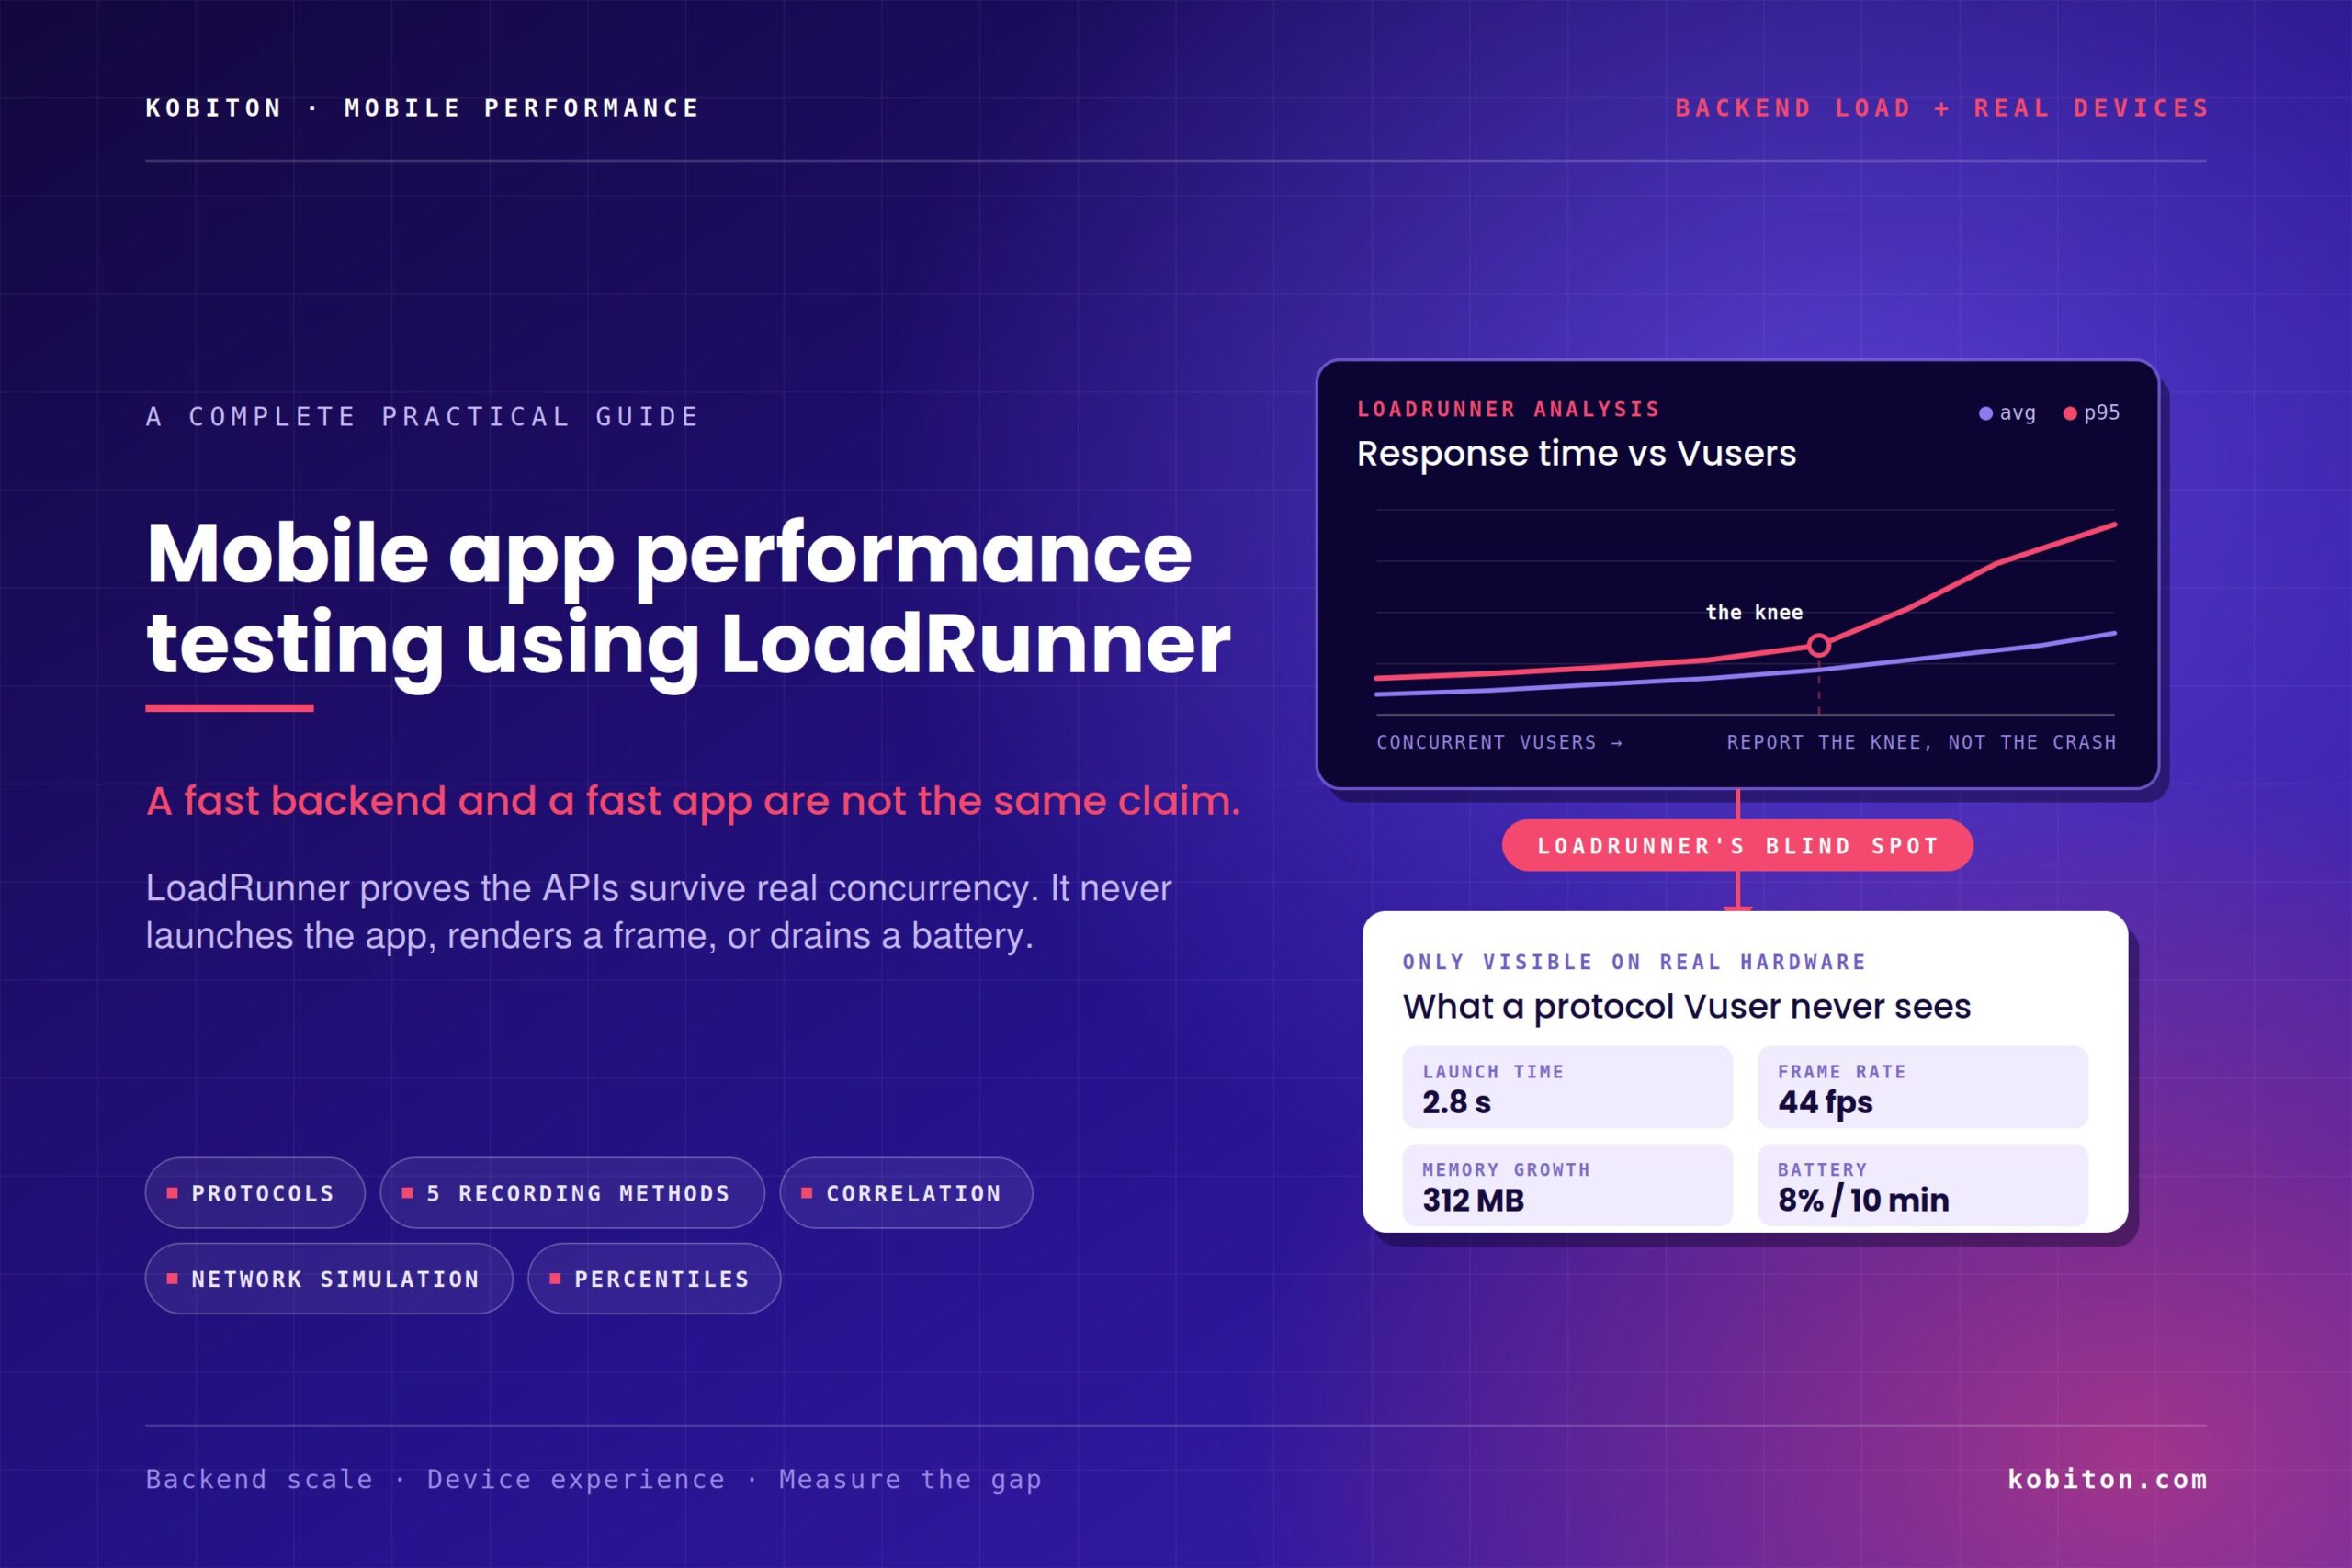
LoadRunner is a heavyweight in the first column. It simulates thousands of virtual users hammering your backend and tells you exactly where the infrastructure buckles. Mobile app performance testing using LoadRunner helps teams evaluate backend performance under load, but it does not tell you that your Android list view drops frames on a mid-tier device, or that the app drains 8% battery in a ten-minute session.
Teams that conflate the two ship apps with a healthy backend and a miserable user experience. Plan for both.
2. Know Your App Type Before You Pick a Protocol
The recording and scripting approach depends entirely on how your app is built:
- Native apps (Swift/Kotlin/Java) — compiled for one platform, talk to the backend over HTTP/HTTPS APIs. Traffic is usually clean JSON. Best suited to protocol-level recording.
- Hybrid apps (React Native, Flutter, Ionic, Cordova) — native shell wrapping web content or a cross-platform runtime. Traffic mixes API calls with asset fetches, which affects how you filter your recording.
- Mobile web apps and PWAs — run in the mobile browser. These behave much like desktop web, so browser-level protocols apply.
A quick mapping:
| App type | Recommended LoadRunner approach |
| Native iOS/Android | Mobile Application – HTTP/HTML |
| Hybrid (native shell + API calls) | Mobile Application – HTTP/HTML |
| Mobile web / PWA / responsive site | TruClient (mobile web) |
| API/microservice backend only | Web – HTTP/HTML or LoadRunner Developer (DevWeb) |
3. Where LoadRunner Sits in the Mobile Performance Tool Landscape
For desktop web load testing you’re spoiled for choice. For native mobile, the field narrows sharply, and it’s worth knowing why you’d choose one over another.
| Tool | Strengths for mobile | Trade-offs |
| LoadRunner | Broadest protocol coverage, mature correlation engine, enterprise-scale load generation, deep analysis and diagnostics integrations | Commercial licensing, steeper learning curve, C-based scripting |
| Apache JMeter | Free, huge plugin ecosystem, easy HTTP proxy recording | Manual correlation, heavier resource use per thread at scale |
| NeoLoad | Strong mobile support, cleaner UI, good CI integration | Commercial, smaller community |
| Fiddler / Charles / mitmproxy | Excellent for capturing and inspecting mobile traffic before scripting | Not load generators — capture only |
| Silk Performer | Enterprise protocol breadth | Smaller ecosystem than LoadRunner |
A common and pragmatic pattern: capture with Fiddler or Charles, script and execute with LoadRunner. Capturing traffic in a dedicated proxy first gives you a clean, readable view of exactly which endpoints fire during a user journey — invaluable before you commit to a script structure.
4. LoadRunner Protocols for Mobile
LoadRunner ships a large protocol library. For mobile, two matter most.
4.1 Mobile Application – HTTP/HTML
This is the workhorse. It records at the transport level, capturing the raw HTTP/HTTPS requests your app sends to the server. It works for both native apps and browser-based mobile apps, as long as communication happens over HTTP.
Because it operates below the UI, it is:
- OS-agnostic — the same approach works across iOS, Android, and older platforms; you’re recording network traffic, not screen interactions
- Extremely lightweight at runtime — no browser or emulator per virtual user, so a single load generator can drive far more concurrency
- Blind to client-side rendering — response times reflect network and server work only
Use this protocol when your goal is backend scalability, which is most of the time.
4.2 TruClient (Mobile Web)
TruClient drives an actual browser engine and records at the UI interaction level. Historically this was the Ajax TruClient-based “Mobile TruClient” protocol; newer LoadRunner versions use a Chromium- or Firefox-based TruClient Browser with mobile device emulation profiles.
Key characteristics:
- Records user actions (tap, scroll, type) rather than raw requests
- Handles heavy JavaScript and dynamic single-page apps where protocol-level scripting becomes painful
- Only works for browser-based mobile applications, not native apps
- Consumes significantly more resources per virtual user, since each Vuser runs a browser instance
Use TruClient when correlation at the HTTP level would be prohibitively complex, or when you need client-side render timings for a mobile web experience.
Choosing between them
| Question | Mobile App – HTTP/HTML | TruClient Mobile Web |
| Native app support | Yes | No |
| Scale per load generator | Very high | Low to moderate |
| Correlation effort | Moderate to high | Low |
| Captures client render time | No | Partially |
| Script maintenance on UI change | Low | Higher |
5. Five Ways to Record a Mobile Script in LoadRunner
This is where mobile diverges most from desktop testing. With TruClient you simply drive a browser. With the Mobile Application – HTTP/HTML protocol you must first choose how to intercept the traffic. LoadRunner’s VuGen offers several routes, and the right one depends on your device access, network topology, and security constraints.
Availability of specific recording modes varies by LoadRunner version. Confirm against your installed release before planning.
5.1 Proxy Recording
VuGen runs as an HTTP proxy; you point the device’s Wi-Fi settings at it, then exercise the app by hand while traffic is captured.
- Requires: device and VuGen machine on the same network; the app must honor system proxy settings
- Best for: teams with physical device access and a cooperative app
- Watch out for: certificate pinning. If the app pins its TLS certificates, proxy interception will fail outright — this is the single most common blocker in modern mobile load testing. You’ll need a non-pinned test build or a different recording method.
5.2 Server-Side Recording (Mobile Sniffer Agent)
Instead of capturing at the device, install VuGen’s Mobile Sniffer Agent on the application server and capture traffic as it arrives.
- Requires: device, server, and VuGen machine reachable on the same network; ability to install an agent on the server
- Best for: situations where you can’t touch device network settings, or where proxy configuration is blocked
- Bonus: sidesteps client-side certificate pinning entirely, since you capture after TLS termination
5.3 Script from Network Capture (Analyze Traffic)
Capture traffic independently — a .pcap from Wireshark, a .har from browser devtools, or an export from Fiddler — then feed the file into VuGen’s Analyze Traffic feature to generate a script.
- Requires: nothing but the capture file
- Best for: distributed teams, devices in another location, or when someone else has already documented the traffic
- Strength: the capture becomes a reusable, reviewable artifact you can hand to another engineer
5.4 Device Emulator Recording
Record the app running inside an Android emulator using VuGen’s emulator recording support.
- Requires: a working emulator with the app installed
- Best for: early development, CI environments, or when physical hardware isn’t available
- Limitation: emulators don’t reproduce real network stacks, radio behavior, or device-specific quirks — fine for script creation, poor for judging real-world behavior
5.5 On-Device Recording (LoadRunner Mobile Recorder)
Install a recorder application on the device itself, capture the session locally, then transfer the resulting file to the VuGen machine to build the script.
- Requires: ability to install the recorder on the device
- Best for: field scenarios, devices on cellular networks, testers who aren’t on the corporate LAN
Recording method comparison
| Method | Device needed | Same network required | Handles cert pinning | Best use case |
| Proxy recording | Yes | Yes | No | Standard in-office setup |
| Server-side (Sniffer Agent) | Yes | Yes | Yes | Proxy blocked on device |
| Network capture file | No | No | Depends on capture | Remote/distributed teams |
| Emulator recording | No | N/A | Varies | Early dev, no hardware |
| On-device recorder | Yes | No | No | Field/cellular testing |
The key takeaway: once the script is recorded, everything downstream — parameterization, correlation, scenario design, analysis — follows the same workflow you’d use for a desktop web application. The mobile-specific difficulty is almost entirely front-loaded into capture.
6. Turning a Raw Recording into a Realistic Script
A freshly recorded script is a transcript, not a test. It will replay a single hardcoded user doing a single hardcoded thing, and it will fail on the second iteration. Four steps fix that.
6.1 Transactions
Wrap each business step in named transactions so your report reads in the language of the product, not the language of HTTP:
lr_start_transaction(“02_Login”);
// requests…
lr_end_transaction(“02_Login”, LR_AUTO);
Use a numbered naming convention (01_Launch, 02_Login, 03_Search) so transactions sort logically in Analysis.
6.2 Correlation (dynamic value handling)
Mobile APIs are token-heavy. Session IDs, JWTs, CSRF tokens, and cart IDs are all generated per session and must be captured from responses at runtime rather than replayed from the recording:
web_reg_save_param_ex(
“ParamName=AuthToken”,
“LB=\”accessToken\”:\””,
“RB=\””,
SEARCH_FILTERS,
“Scope=Body”,
LAST);
web_custom_request(“login”,
“URL=https://api.example.com/v2/auth/login”,
“Method=POST”,
“EncType=application/json”,
“Body={\”username\”:\”{pUsername}\”,\”password\”:\”{pPassword}\”}”,
LAST);
web_add_header(“Authorization”, lr_eval_string(“Bearer {AuthToken}”));
Note that the registration function is placed before the request whose response it parses — a classic stumbling block. LoadRunner’s auto-correlation and Correlation Studio can find many of these automatically by comparing two recordings, but always verify manually; auto-correlation misses values buried in nested JSON or custom headers.
6.3 Parameterization
Replace hardcoded user data with parameter files so a thousand virtual users don’t all log in as the same account and hit an artificially warm cache:
- User credentials, search terms, product IDs, postal codes
- Set update method to Unique / Each iteration for data that can’t be reused (one-time coupon codes, registration emails)
- Size your data pool for the full run: 500 Vusers × 20 iterations needs 10,000 unique rows
6.4 Mobile-specific headers
Don’t let your virtual users masquerade as desktop browsers. Preserve the recorded User-Agent, device identifiers, app version headers, and any custom headers your API uses for routing or feature flags. Backends frequently return different payloads based on these — testing with the wrong header means testing the wrong code path.
7. Runtime Settings and Network Conditions
This is the step most teams skip, and it’s the one that makes mobile results credible.
Runtime settings that matter
| Setting | Mobile guidance |
| Think time | Keep it, and randomize it (e.g. 50–150% of recorded). Mobile users pause to read; zero think time produces unrealistic request density |
| Pacing | Control iteration rate to hit a target throughput rather than just maximizing concurrency |
| Browser emulation / caching | Simulate a mix of first-time and returning users; cached-asset behavior differs enormously |
| Download filters | Decide deliberately whether to fetch CDN assets and third-party SDK calls. Excluding them makes the test cleaner; including them makes it more realistic |
| Connections per host | Match what the mobile HTTP client actually opens, not the browser default |
| Error handling | Continue on error for non-critical steps, fail fast on authentication |
Network simulation
A test run over gigabit office Wi-Fi tells you almost nothing about how the app behaves on a train. LoadRunner integrates with network virtualization to shape bandwidth, latency, packet loss, and jitter per virtual user group.
Build a realistic mix rather than a single profile:
| Profile | Approx. bandwidth | Added latency | Packet loss |
| 5G / strong Wi-Fi | 100+ Mbps | 10–20 ms | 0% |
| Good 4G LTE | 10–20 Mbps | 50–80 ms | 0–0.5% |
| Congested 4G | 2–5 Mbps | 100–200 ms | 1–2% |
| 3G | 750 Kbps–1.5 Mbps | 200–400 ms | 2–5% |
| Edge-of-coverage | < 500 Kbps | 400 ms+ | 5%+ |
Latency, not bandwidth, is usually what kills mobile UX — especially for chatty APIs that make ten sequential round trips to paint one screen. Network simulation is how you expose that.
8. Designing the Load Scenario
With the script hardened, design the test in the Controller (or LoadRunner Enterprise / Cloud):
- Load test — ramp to expected peak concurrency and hold; confirm SLAs are met
- Stress test — push past peak until something breaks; find the ceiling and observe how it fails
- Spike test — sudden surge, mimicking a push notification blast or marketing drop. This is the mobile-native failure mode: a notification to two million devices creates a load pattern nothing else does
- Endurance/soak test — sustained moderate load for hours to surface memory leaks and connection pool exhaustion
- Scalability test — step the load in increments and chart where response time curves inflect
Mix your Vuser groups to reflect reality: 70% browsing, 20% searching, 10% transacting is a far better model than 100% checkout.
9. Analyzing the Results
LoadRunner’s Analysis component produces the graphs; the skill is knowing which numbers matter.
KPIs worth tracking
| Metric | Why it matters |
| Average transaction response time | Baseline health — but never rely on it alone |
| 90th / 95th / 99th percentile | The real user experience. A 1.2s average hiding a 9s p95 means one in twenty users is having a terrible time |
| Throughput (bytes/sec) | Payload efficiency. Bloated JSON responses are a silent mobile killer on metered connections |
| Hits per second | Request density; helps identify chatty API design |
| Error rate under load | Where and when the system starts refusing work |
| Concurrent Vusers vs response time | The inflection point where scaling breaks down |
| Server resource counters | CPU, memory, disk I/O, GC pauses, thread pool and DB connection saturation |
Reading the results
- Correlate curves, don’t read them in isolation. Overlay response time against active Vusers and server CPU. If response time climbs while CPU stays flat, you’re likely blocked on I/O, a connection pool, or an external dependency — not compute.
- Look for the knee. The point where the response time curve bends upward is your practical capacity ceiling. Report that, not the crash point.
- Chase percentiles, not averages. Averages hide exactly the tail latency that generates support tickets.
- Feed in APM data. Pairing LoadRunner results with Dynatrace, AppDynamics, New Relic, or similar turns “the checkout API is slow” into “this specific database query is slow.”
- Compare against a baseline. A single test run is a data point. A trend across builds is an early warning system.
10. The LoadRunner Blind Spot — and How to Cover It
Everything above measures your backend. That’s essential, and it’s what LoadRunner does better than almost anything else. But your users don’t experience your backend. They experience an app on a specific device, on a specific OS version, with a specific amount of free memory.
LoadRunner’s protocol-level virtual users can’t see:
- App launch time — cold start, warm start, and time-to-interactive on real hardware
- Rendering performance — frame rate, dropped frames, scroll jank, animation smoothness
- Device resource consumption — CPU, memory growth over a session, thread contention
- Battery drain — a top-three uninstall reason that no protocol test will ever surface
- Device fragmentation — the same build behaving differently on a flagship versus a three-year-old mid-range Android
- OS-level interruptions — incoming calls, backgrounding, low-memory kills, permission dialogs
- Real-network behavior — handoffs between Wi-Fi and cellular, radio wake-up costs
These only appear on real devices. An emulator won’t reproduce them; a protocol-level Vuser doesn’t even attempt to.
The combined workflow
The strongest mobile performance practice runs both layers together:
- Script and execute backend load with LoadRunner — establish that your APIs hold up at target concurrency.
- Simultaneously drive real-device sessions on a device cloud like Kobiton, running the actual app against that same loaded backend.
- Capture device-side metrics — launch time, CPU, memory, network payloads, and session video — while the backend is under pressure, not while it’s idle.
- Compare loaded vs unloaded device sessions. This is the measurement that matters most and the one teams almost never take: how much worse is the user experience when the backend is at 80% capacity?
- Test across a real device matrix — flagship, mid-range, and older hardware; current and previous OS versions — because performance regressions rarely show up uniformly.
- Wire both into CI/CD so performance is a gate, not a pre-release scramble.
Running Appium-based or scriptless sessions against real devices while LoadRunner generates concurrent backend load gives you the complete picture: server capacity and the experience that capacity actually delivers.
11. Common Pitfalls and Practical Tips
- Certificate pinning will break proxy recording. Plan for it. Request a non-pinned QA build, or use server-side capture.
- Record on a clean device state. Background sync, OS updates, and other apps pollute captures. Airplane mode → Wi-Fi only → force-stop other apps.
- Always verify replay before scaling. Run one Vuser, one iteration, and confirm the responses are genuinely correct — HTTP 200 with an error message in the body is still a failed test. Add content checks with web_reg_find.
- Don’t test only the happy path. Failed payments, expired tokens, and retry storms have distinct load signatures.
- Model push-notification spikes explicitly. They’re the most mobile-specific load pattern and the one most likely to take you down.
- Watch payload size, not just response time. A 2 MB JSON response that returns in 400 ms on office Wi-Fi is a disaster on 3G.
- Version your scripts in Git alongside application code. Correlation logic rots when APIs change.
- Test third-party SDKs. Analytics, ads, crash reporting, and auth providers all add network calls you didn’t write and can’t fix at 3 a.m.
12. Frequently Asked Questions
Can LoadRunner test native iOS and Android apps?
Yes. The Mobile Application – HTTP/HTML protocol records at the network transport layer, which makes it OS-agnostic — the same approach works across iOS, Android, and other platforms as long as the app communicates over HTTP/HTTPS.
Do I need physical devices to script in LoadRunner?
Not necessarily. You can generate scripts from a network capture file or record against an emulator. But emulators aren’t a substitute for real devices when you’re evaluating actual performance, only when you’re creating scripts.
LoadRunner or JMeter for mobile?
JMeter is free and capable, with a strong plugin ecosystem, but expect substantially more manual correlation work. LoadRunner offers deeper protocol coverage, mature auto-correlation, and better analysis tooling — at commercial licensing cost. Enterprises with existing LoadRunner investment and complex protocol needs generally stay with it.
How many virtual users do I need?
Derive it from production data: peak concurrent sessions, not total installs or monthly actives. Then test at 1.5–2× that peak so you have headroom for growth and unexpected spikes.
Does LoadRunner measure app launch time or battery usage?
No. Those are client-side metrics that require instrumentation on a real device. LoadRunner measures the server side of the interaction; pair it with a real-device testing platform for the rest.
How do I test with certificate pinning enabled?
Either use server-side recording with the Mobile Sniffer Agent (which captures after TLS termination), or get a build from your development team with pinning disabled for the QA environment.
Conclusion
LoadRunner remains one of the few tools that can genuinely support mobile app performance testing using LoadRunner and load test a native mobile application end to end. Its protocol breadth, OS-agnostic transport-level recording, five distinct capture methods, and mature correlation and analysis stack solve the hardest part of the problem: proving your backend survives real concurrency.
But a fast backend and a fast app are not the same claim. Protocol-level virtual users never launch your app, never render a frame, and never drain a battery. The teams shipping genuinely fast mobile experiences run both halves of LoadRunner for backend scale, real devices for the experience that scale delivers and treat the gap between them as a metric in its own right.
Start with a clean capture. Harden the script. Simulate the network your users actually have. Then go measure what’s happening on the device.
