Users decide whether they like an app in the first few seconds. A screen that stalls, a scroll that stutters, a session that drains the battery, or a crash at the wrong moment can undo months of feature work. With billions of smartphone users worldwide and the overwhelming majority of screen time spent inside apps rather than browsers, the bar for a “fast, reliable app” has never been higher and the competition is one tap away in the store.
Measuring mobile app performance is how you keep that bar in sight. Understanding How to Measure Mobile App Performance helps turn vague complaints like “the app feels slow” into concrete numbers you can track, compare, and improve. This guide walks through what mobile app performance actually means, the metrics that matter most, the different types of performance testing, and a practical, repeatable process for measuring performance across real-world conditions.
What “Mobile App Performance” Really Means
Mobile app performance is a measure of how well an app responds, renders, and behaves across the full range of conditions your users experience. It is not a single number. It spans how quickly the app launches, how smoothly it renders each frame, how efficiently it uses the CPU, memory, and battery, how gracefully it handles weak or intermittent networks, and how often it crashes or freezes.
Three characteristics make mobile performance uniquely hard to measure compared with web or backend systems:
• Device diversity. Your app runs on a sprawling range of hardware — flagship phones with 120Hz displays and budget devices with limited memory, across many Android and iOS versions. Behavior that is smooth on a test bench can fall apart on a three-year-old handset.
• Network variability. Users move constantly between fast Wi-Fi, congested cellular, and near-zero connectivity. An app that assumes a stable connection will disappoint the moment the signal drops.
• Constrained resources. Phones must balance your app against every other process, all on a finite battery. Excessive memory allocation, background activity, or CPU spikes are punished quickly — both by the operating system and by users who notice the heat and the drain.
Because of this, meaningful performance measurement always accounts for the environment: the device, the OS version, and the network conditions under which a metric was recorded.
The Core Metrics You Should Measure
Performance measurement starts with choosing the right indicators. The metrics below are the ones that most directly shape user experience, retention, and store rankings. Track them continuously, and always segment the results by device model, OS version, app version, and network condition so an average never hides a serious problem on a specific slice of your user base.
App Startup and Load Time
Startup time is the duration from the moment a user taps the icon to the moment the app is ready to use, including the first screen render. It is the first impression, and it is measured across three distinct start types:
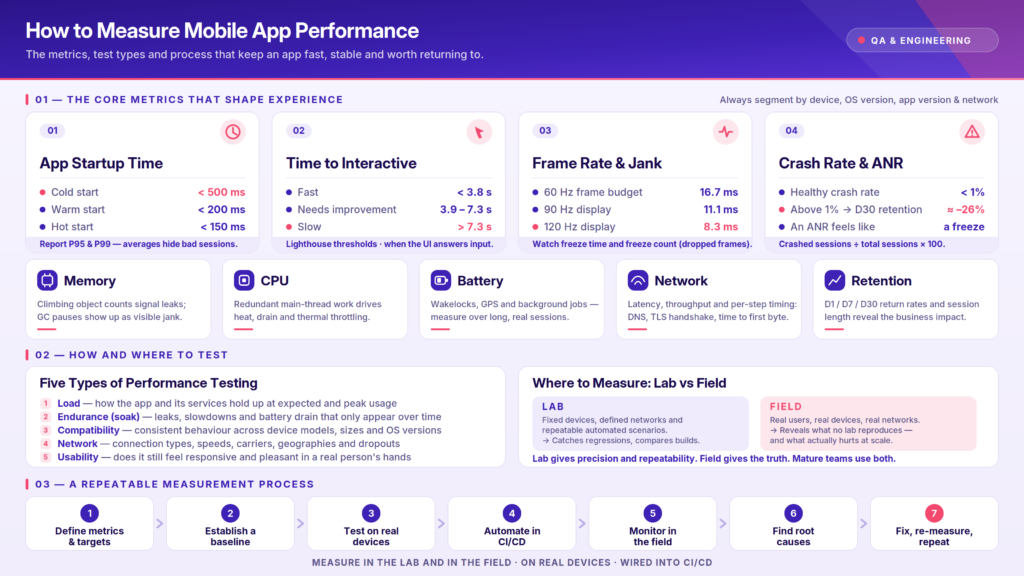
• Cold start — the app is not in memory and must initialize from scratch. This is the slowest path and the one users judge most harshly. A widely used target is under 500 milliseconds.
• Warm start — the process is still alive in the background but the UI needs to be rebuilt. A reasonable target is under 200 milliseconds.
• Hot start — the activity is cached in memory and only needs to return to the foreground, ideally under 150 milliseconds.
Because averages can be misleading, measure the 95th and 99th percentile (P95 and P99) latencies as well, not just the median. A median of 400ms with a P99 of three seconds means a meaningful share of your users are having a bad experience.
Time to Interactive (TTI)
Load time tells you when something appears; Time to Interactive tells you when the user can actually do something. TTI is the interval from the start of a screen load to the point where all elements are displayed, data is loaded, and the interface responds to input. A screen that paints quickly but ignores taps creates a frustrating “false start.”
Google’s Lighthouse thresholds offer a useful yardstick: under 3.8 seconds is fast, 3.9 to 7.3 seconds needs improvement, and over 7.3 seconds is slow. Measure TTI on real devices and segment by device type and network so you understand the experience your slowest users are actually getting.
Rendering Performance, Frame Rate, and Jank
Smooth motion depends on the app rendering frames at the display’s cadence. At 60 frames per second, the app has roughly 16.7 milliseconds to produce each frame; newer devices push 90Hz or 120Hz, shrinking that budget further. When a frame misses its deadline, the result is jank — the visible stutter during scrolling, animations, or screen transitions.
Useful rendering metrics include average frame render time, freeze time (the cumulative time spent on slow frames that exceed the budget), and freeze count (the number of dropped frames). On Android, jank often shows up as disruption to the regular Choreographer.doFrame() cadence, and in modern Compose UIs it frequently traces back to excessive recompositions or poorly keyed lazy lists. Offloading heavy work to background threads, recycling views in long lists, and optimizing image assets are common fixes.
Crash Rate and ANR
The crash rate is the percentage of sessions that end in a crash — calculated as crashed sessions divided by total sessions, times 100. It is one of the most consequential metrics you can track: apps that exceed a 1% crash rate see roughly a 26% drop in 30-day user retention on average, alongside damaged store rankings and eroded trust. It is worth also tracking crash-free users — the share of people who never hit a crash in a given period.
Closely related is the ANR (Application Not Responding) event, where the app’s main thread is blocked long enough that the OS flags it as unresponsive. ANRs are, from the user’s perspective, indistinguishable from a freeze, and they should be monitored with the same seriousness as crashes. Segment both by OS version, device model, app version, and network condition so you can prioritize the fixes that touch your core flows first.
Memory Usage
Memory pressure is a silent killer of mobile performance. Excessive allocation forces frequent garbage collection, which pauses execution and causes jank; sustained high memory use can get your app killed by the OS or slow down everything else on the device. When measuring, watch for steadily climbing object counts (a classic sign of a leak), the frequency of garbage collection events, and the difference between shallow and retained memory for suspect objects. The goal is not to eliminate every allocation but to find and fix the hotspots on the paths that run most often.
CPU Usage
High CPU consumption translates directly into heat, battery drain, and — on thermally throttled devices — slower performance across the board. Measuring CPU usage during representative workflows helps you spot inefficient algorithms, redundant work on the main thread, and background activity that should be deferred or batched.
Battery Consumption
Battery drain is one of the fastest routes to an uninstall. Power is consumed by CPU-heavy work, frequent network calls, wakelocks, GPS, and unnecessary background processing. Because power inefficiencies are hard to spot in a quick test, they are best measured over longer sessions and on real hardware, where actual battery behavior can be observed rather than estimated.
Network Latency and Throughput
Most apps depend on the network, so its behavior is part of your performance profile. Track network latency (the delay in data transmission), throughput, and the timing of the individual steps in a request — DNS resolution, TLS handshake, and time to first byte. Critically, measure these under a range of conditions, from strong Wi-Fi to throttled 3G, because an app that feels instant on the office network may be unusable on a commuter train.
Engagement Signals: Retention and Session Length
Performance metrics are leading indicators; engagement metrics show the downstream impact. Retention rate — the share of users returning on Day 1, Day 7, and Day 30 — tends to fall when performance is poor, and session length can reveal friction when it drops unexpectedly. Watching these alongside your technical metrics helps you connect an engineering improvement to a business outcome.
The Types of Mobile Performance Testing
Measuring performance well means exercising the app in the ways it will actually be used. Several complementary test types each surface a different class of problem:
• Load testing evaluates how the app and its supporting services behave under expected and peak usage, revealing slowdowns before real traffic does.
• Endurance (soak) testing runs the app over an extended period to surface issues that only appear over time, such as memory leaks, gradual slowdowns, and battery drain.
• Compatibility testing verifies consistent behavior across the many device models, screen sizes, and OS versions in your user base.
• Network testing measures behavior across different connection types, speeds, carriers, and geographies, including graceful handling of intermittent connectivity.
• Usability testing confirms that the app remains responsive and pleasant to use, tying the raw numbers back to the human experience.
Where to Measure: Lab Metrics vs. Field Metrics
A robust measurement strategy uses two complementary environments.
Lab measurement happens in a controlled setting specific devices, defined network conditions, and repeatable, automated test scenarios. Because the variables are fixed, lab tests are ideal for catching regressions, running A/B comparisons between builds, and profiling a specific user journey in depth. To keep results trustworthy, always test on production-grade builds (never debug builds), keep the device model and OS version constant when comparing, and use benchmarking frameworks designed to reduce measurement noise.
Field measurement captures how the app performs in the hands of real users, across the full, uncontrollable diversity of devices and networks. Field data reveals problems that no lab can fully reproduce and tells you which issues actually affect people at scale. Store consoles and observability SDKs surface field metrics such as startup time, frame vitals, and crash reports.
Neither is sufficient alone. Lab measurement gives you precision and reproducibility; field measurement gives you truth about the real world. Mature teams use lab testing to prevent regressions and field monitoring to catch what slipped through.
Tools for Measuring Mobile Performance
The tooling landscape spans platform-native profilers, cross-platform test frameworks, and observability platforms.
On Android, the native toolkit is deep: Perfetto and Systrace for system-wide tracing, Android Studio’s CPU and Memory Profilers for real-time analysis, the Macrobenchmark library for user-experience metrics like startup and scrolling, the Microbenchmark library for fine-grained code-level measurement, the JankStats library and FrameMetricsAggregator for frame timing, and Battery Historian for power analysis. A key discipline: measure on release-configured builds with code shrinking enabled, and reserve techniques like clock-locking for microbenchmarks rather than user-experience tests.
On iOS, Xcode Instruments provides equivalent capabilities, including Core Animation instruments for rendering and Time Profiler for CPU work.
For load and network performance, tools such as JMeter and cloud platforms like BlazeMeter simulate traffic and varied network conditions at scale, and Google Lighthouse provides standardized thresholds for interactivity. For field observability, SDKs that capture crashes, stack traces, and session context — with continuous monitoring in production — close the loop between lab results and real-world behavior.
The most important selection criteria are automated testing support, access to real devices, integration with your CI/CD pipeline, and scalability that matches your team and budget.
A Practical Process for Measuring Performance
1. Define your metrics and targets. Choose the indicators that matter for your app — startup time, TTI, frame rate, crash rate, memory, CPU, battery, and network — and set concrete thresholds for each.
2. Establish a baseline. Measure current performance on representative devices and networks so you have something to compare against.
3. Test on real devices across real conditions. Combine real hardware with emulators for coverage, but anchor your key numbers to real devices and the network conditions and locations where your users actually are.
4. Automate and run continuously. Wire performance tests into your CI/CD pipeline so every build is checked, and catch regressions the moment they are introduced rather than after release.
5. Monitor in the field. Complement lab testing with production observability to capture the problems only real users encounter.
6. Analyze root causes, not symptoms. Use profilers and traces to find why a metric regressed — an allocation hotspot, a blocked main thread, a slow network step — rather than treating the symptom.
7. Fix, re-measure, and repeat. Confirm each optimization actually moved the metric, then fold performance checks into your ongoing development rhythm.
Best Practices for Reliable Measurement
Test early and continuously rather than treating performance as a pre-release afterthought; problems are cheaper to fix when caught in development. Balance real devices with simulators to expand coverage without exhausting your budget, but keep your headline metrics anchored to real hardware. Target your users’ actual locations, carriers, and network speeds instead of only the fast connection in your office. Monitor resource consumption CPU, memory, and battery not just speed. Always measure on production-grade builds, and keep test conditions consistent when comparing versions. Finally, make performance part of your team’s DNA: measure the impact of a feature before you ship it, not after users complain.
Measuring Performance on Real Devices with Kobiton
Most of the metrics in this guide share one requirement: to be trustworthy, they need to be captured on real devices under real conditions. Emulators and simulators are useful for early, low-cost coverage, but they cannot reproduce actual CPU and thermal behavior, genuine battery consumption, real GPU rendering on physical silicon, or the touch responsiveness users feel. This is where a real-device platform earns its place in the workflow.
Kobiton is a mobile experience platform built around testing on real Android and iOS devices available as a cloud device lab and with on-premise options for teams with stricter requirements. For performance measurement specifically, that real-device foundation lets teams capture the client-side metrics that matter app launch time, frame rate against the 60 fps target, CPU and memory consumption, battery impact, and crash and ANR rates alongside network-level timings such as time-to-interactivity, DNS resolution, and TLS handshake duration, all recorded on the same hardware your users carry.
Kobiton also addresses the two conditions that trip up lab measurement. Network shaping lets you reproduce slow, congested, or intermittent connections on demand, and geolocation capabilities let you observe behavior across different regions and carrier environments — so the network metrics you record reflect the real world rather than an idealized office connection. Sessions are captured in unified dashboards with replays, logs, and KPIs, which shortens the path from “a metric regressed” to “here is the root cause.”
For teams moving toward continuous measurement, Kobiton supports Appium-based automation and scriptless options, adds AI-powered test generation and self-healing to reduce maintenance on critical flows, and provides first-class CI/CD hooks and REST APIs so performance sessions can run automatically on every build. Enterprise controls such as SSO/SAML and role-based permissions round out the platform for larger organizations. Compared with relying on emulators or piecing together separate device labs, profilers, and network tools, consolidating real-device performance sessions, network simulation, and CI/CD integration in one place removes much of the friction that keeps teams from measuring performance as often as they should.
Conclusion
Measuring mobile app performance is not a one-time gate before launch it is a continuous discipline that spans the whole lifecycle. Understanding How to Measure Mobile App Performance starts with choosing the metrics that reflect real user experience: startup time and TTI, frame rate and jank, crash rate and ANR, memory, CPU, battery, and network behavior. Measure them in both the lab and the field, on real devices across the conditions your users live in, and wire those measurements into CI/CD so regressions surface immediately. The teams that treat performance as a first-class, continuously measured concern rather than something they check when users complain are the ones that keep their apps fast, stable, and worth returning to.
