Nov 3, 2026
How to Use AI in Automation Testing: Scripts, Agents, or Both?

Frank Moyer
Read More
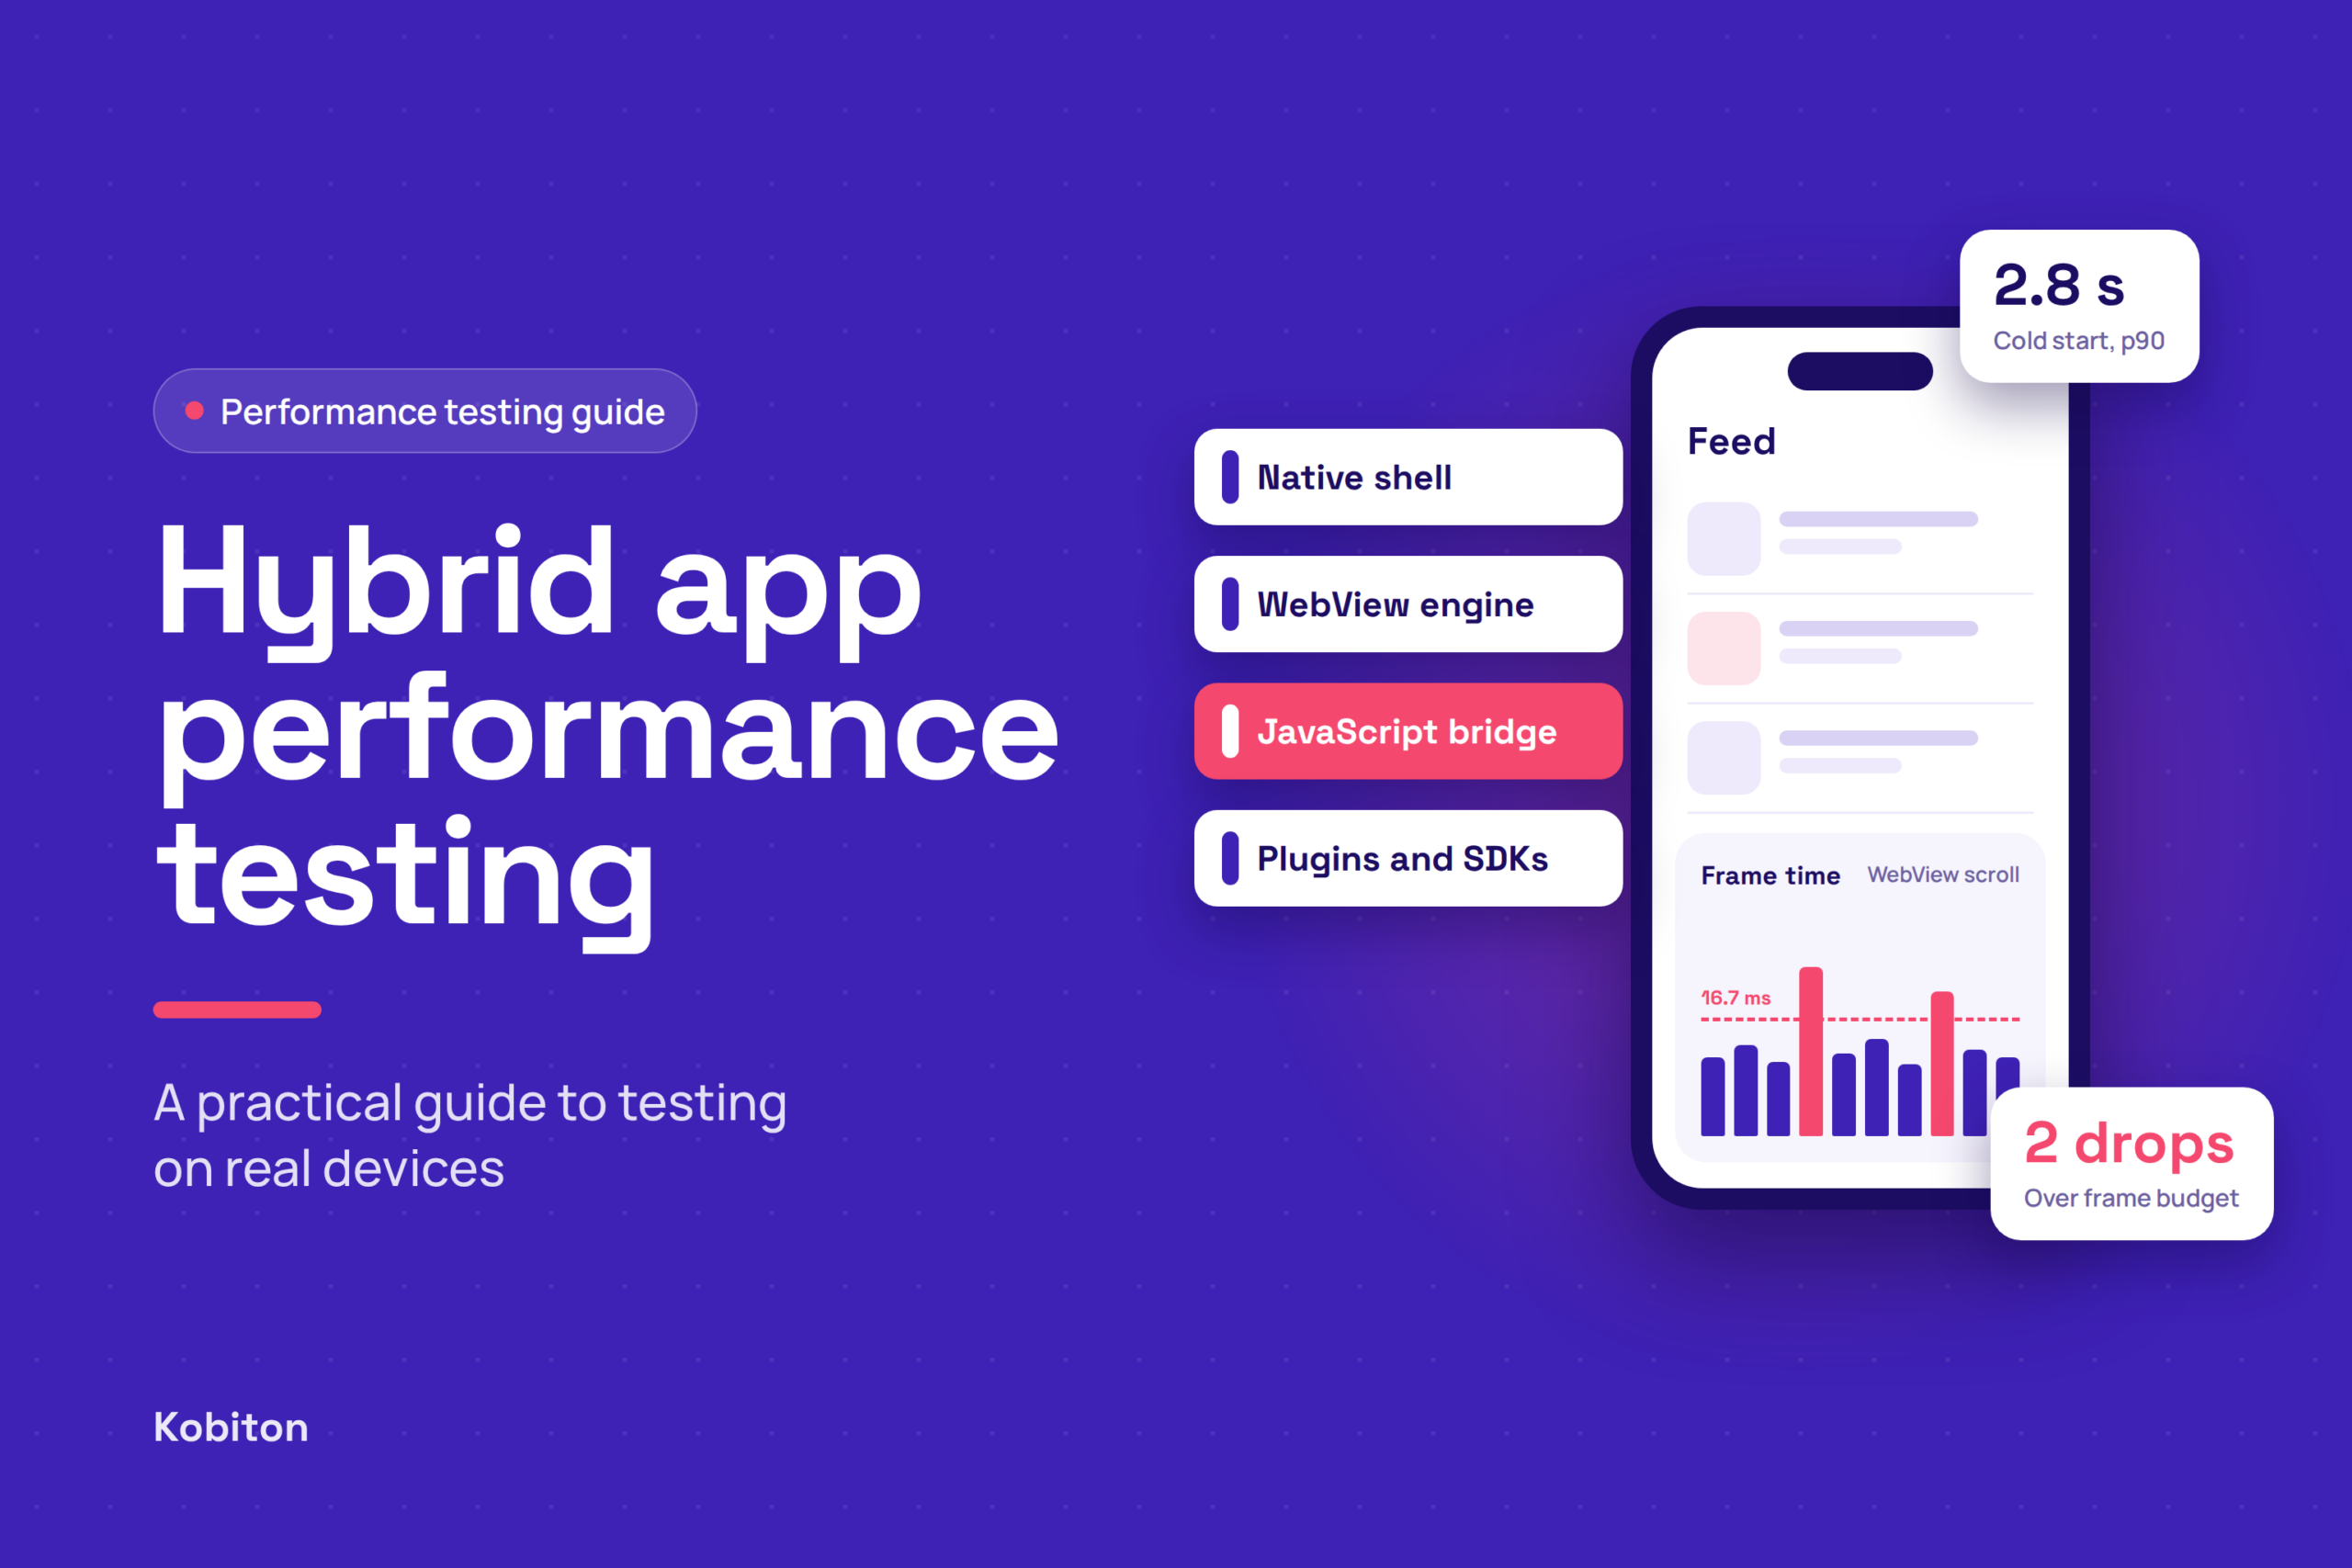
Hybrid mobile app performance testing measures how fast, stable, and resource efficient a hybrid app is on the phones and tablets your users actually own. A hybrid app wraps web code (HTML, CSS, and JavaScript) inside a native shell and renders it through a WebView. That design lets one team ship to iOS and Android from a single codebase, but it adds layers a fully native app never has to carry: a browser engine, a bridge between JavaScript and native code, and a stack of third party plugins.
Each of those layers costs something in CPU, memory, battery, and network. The cost also shifts from one device to the next, depending on the chipset, the OS version, and the WebView build installed. That is why a hybrid app that feels instant on a developer laptop or an emulator can feel sluggish on a three year old midrange Android phone, which is exactly the kind of device a large share of your users carry every day.
This guide covers how hybrid apps fail under real conditions, which metrics to watch, how to build a real device test matrix, a repeatable step by step process, framework specific pitfalls, the right tool for each layer, and how to run the whole thing inside your CI/CD pipeline. It is written for QA engineers, mobile developers, and engineering leads who own release quality.
Who this guide is for: teams shipping apps built with Ionic, Capacitor, Apache Cordova, or any native shell that loads web content. It is also useful for teams running React Native or Flutter who want a consistent cross platform performance baseline.
Most hybrid performance problems start in one of four layers, and each layer fails in its own way. Follow a single tap: the native touch handler passes the event into the WebView, JavaScript runs on a single main thread, the code may cross the bridge to call a native plugin such as the camera, storage, or GPS, and the result travels back to the WebView so it can repaint. Every hop adds latency, and the WebView competes with the native shell for the same CPU and memory the whole time.
| Layer | What it does | What goes wrong | What the user sees |
| Native shell | Boots the app, hosts the WebView, and handles OS events | Heavy plugin initialization at launch; WebView created too late | A long white or blank screen on cold start |
| WebView engine | Parses HTML and CSS, runs JavaScript, and paints frames (WKWebView on iOS, Android System WebView on Android) | Large JS bundles, layout thrashing, oversized DOM trees, expensive CSS effects | Slow first screen, stutter while scrolling, delayed taps |
| JavaScript bridge | Serializes calls and data between JavaScript and native code | Chatty calls, large payloads such as base64 images, synchronous waits | UI freezes whenever the camera, file system, or sensors are in use |
| Plugins and SDKs | Camera, push notifications, analytics, payments, maps | Plugins that block the main thread or leave listeners attached | Memory growth over a session, battery drain, crashes after long use |
Two platform facts shape every hybrid test plan:
This is the core reason hybrid apps need their own performance strategy. The same JavaScript runs on engines you do not control, on hardware you cannot predict, so the only reliable answer comes from measuring on the devices themselves.
Emulators and simulators are fine for functional checks, but their performance numbers should never drive a release decision. They run on desktop CPUs with desktop memory and desktop cooling, which hides the exact conditions that make WebView rendering slow.
| Factor | Emulator or simulator | Real device |
| CPU and GPU | Host machine hardware, often far faster than a midrange phone | The actual ARM chipset, GPU, and clock speeds your users have |
| Thermal throttling | None | The CPU slows down after a few minutes of heavy use, and frame rates drop with it |
| Memory pressure | Generous RAM; background apps are rarely killed | The OS kills or reloads the WebView when RAM runs low |
| WebView build | Whatever system image you installed | The engine version actually shipped and auto updated on that phone |
| OEM customization | Stock Android | Vendor skins, battery savers, and background limits from Samsung, Xiaomi, OPPO, and others |
| Battery and power states | Simulated or missing entirely | Real drain, Low Power Mode or battery saver, charging versus unplugged |
| Network radio | Host network with low latency | A real cellular radio, handoffs between WiFi and 4G/5G, weak signal areas |
| Sensors and plugins | Mocked camera, GPS, and biometrics | Real hardware calls across the JavaScript bridge |
A practical split works well for most teams. Use emulators for fast functional feedback on every commit, then run performance tests on a curated set of real devices before merges to main and before every release. One run on a real budget phone often tells you more than a hundred emulator runs, because it surfaces the throttling, memory kills, and engine quirks your users actually run into.
Track two families of metrics: native side numbers the OS reports, and web side numbers measured inside the WebView. A hybrid app can pass one family and fail the other. A test that only watches CPU and memory will miss a sluggish JavaScript layer, and a Lighthouse score on its own will miss a slow native boot.
| Metric | Layer | Why it matters for hybrid apps | Starting target |
| Cold start time (TTID) | Native | Includes shell boot, plugin initialization, and WebView creation | Under 5 s; Android vitals flags a cold start of 5 s or longer as excessive (Android Developers) |
| Warm and hot start | Native | Shows whether the WebView survives being sent to the background | Under 2 s warm and under 1.5 s hot (same source) |
| Time to first meaningful screen | Web | The splash screen hides the native boot, but the single page app still has to load and render | Set it from your baseline; aim for under 3 s on a midrange device |
| Interaction latency (similar to INP) | Web | The delay between a tap and the next paint, driven by JavaScript work on the main thread | 200 ms or less counts as good on the web scale (web.dev) |
| Long tasks | Web | Any JavaScript task over 50 ms blocks taps and scrolling | Zero long tasks during scrolls and screen transitions |
| Frame rate and dropped frames | Both | WebView scrolling and CSS animations stutter on weaker GPUs | 60 fps (16.7 ms per frame); 8.3 ms per frame on 120 Hz screens |
| CPU usage | Native | JavaScript loops, polling, and analytics SDKs keep cores busy | No sustained spikes while idle; track peaks for each flow |
| Memory (PSS or footprint) | Both | Large DOM trees and image caches get the WebView killed on low RAM phones | A flat line across a repeated flow; any steady climb points to a leak |
| Bridge call count and payload size | Bridge | Chatty or bulky plugin calls freeze the UI | Batch calls, keep payloads small, and never send base64 images over the bridge |
| Network requests, bytes, and time to first byte | Both | Hybrid apps often fetch many small assets at boot | Fewer requests on launch; cache static assets locally |
| Battery drain | Native | Timers, wake locks, and GPS plugins drain power | Compare mAh or percent used per 30 minute session against the last release |
| Crash and ANR rate | Native | WebView renderer crashes and main thread stalls | Android shows an ANR when input gets no response for 5 s; track the rate for every build |
Two habits make these numbers trustworthy:
No single test covers a hybrid app. Each type below answers a different question, and most teams need at least the first five in place before every release.
| Test type | Question it answers | How to run it on real devices | Hybrid specific focus |
| Startup testing | How long until the user can act? | Force stop the app, clear it from recents, launch it 10 or more times, and record TTID and the first usable screen | Plugin initialization order, splash screen timing, WebView warm up |
| Responsiveness testing | Do taps and scrolls feel instant? | Scripted flows such as login, search, and checkout, with timestamps for each step | Long JavaScript tasks, layout recalculation, event handler cost |
| Rendering testing | Does the UI stay smooth? | Long scrolls through lists and feeds, animated transitions, frame capture | CSS transforms versus layout triggering properties, DOM size |
| Memory and endurance (soak) testing | Does the app degrade over time? | Repeat a core flow 50 to 200 times, or run it continuously for 1 to 2 hours | Detached DOM nodes, listeners that never get removed, growing image caches |
| Network condition testing | How does it behave on poor connections? | Throttle to 3G, add high latency and packet loss, and switch from WiFi to cellular in the middle of a flow | Asset loading, retry logic, offline cache, service workers |
| Battery and thermal testing | Does it drain power or overheat? | 30 to 60 minute sessions while unplugged, measuring drain and the CPU temperature trend | Timers, GPS and Bluetooth plugins, background sync |
| Interruption testing | Does it recover cleanly? | Incoming calls, notifications, app switching, screen lock, Low Power Mode or battery saver | WebView reloads on resume, lost state, rerender cost |
| Backend load testing | Does the server hold up at peak traffic? | JMeter, k6, or Gatling against your APIs while devices run real user flows | Combine server load with client side metrics to see the real impact on users |
| Release comparison testing | Did this build get slower? | Same devices, same flows, and the same network profile, compared against the last release | Catches regressions from new plugins, SDK updates, and WebView updates |
Server load testing alone is not hybrid app performance testing. A fast API does not help if the WebView then takes two seconds to parse the response and repaint the screen. Pair backend load with on device measurement so you see what the user actually feels, not just what the server reports.
Choose devices from your own analytics, not from a generic list of popular phones. Pull the last 90 days of sessions grouped by device model, OS version, and, on Android, WebView version. Then organize them into tiers so every test run covers your fastest, most typical, and weakest users.
| Tier | What it represents | Example profile | Why it belongs in the matrix |
| Budget Android | The weakest hardware with real usage share | 3 to 4 GB RAM, budget chipset, Android 2 to 3 versions behind current | The first place WebView jank, memory kills, and slow cold starts show up |
| Midrange Android | Your typical Android user | 6 to 8 GB RAM, a popular Samsung Galaxy A series model or similar | Sets your realistic performance baseline |
| Flagship Android | Best case performance | A current Pixel or Galaxy S series phone on the latest Android | Confirms 120 Hz rendering and behavior on the newest OS |
| Oldest supported iPhone | Your iOS floor | The oldest model that runs your minimum iOS version | Shows WebKit on older hardware with tighter RAM limits |
| Current iPhone | Typical and best case iOS | The latest or previous generation iPhone on the latest iOS | Catches new WebKit changes and ProMotion display behavior |
| Tablet (if supported) | Large layouts | An iPad and an Android tablet | Larger viewports mean bigger DOM trees and more pixels to paint |
A few rules keep the matrix useful as it grows:
This process turns ad hoc profiling into a repeatable test you can run on every release. Each step builds on the one before it, so skipping the baseline in step 4 makes every later number hard to interpret.
Your framework decides where the bottlenecks live. WebView based frameworks such as Cordova and Ionic with Capacitor share the same browser engine problems. React Native and Flutter are often grouped with hybrid frameworks because they share one codebase across platforms, but they render very differently and need their own checks.
| Framework | Rendering model | Typical hotspots | What to test on real devices |
| Apache Cordova | The full UI runs in a WebView; plugins communicate over a JavaScript bridge | Outdated plugins, large bundles, slow deviceready events | Time from launch to deviceready, plugin call latency, memory over long sessions |
| Ionic with Capacitor | Web UI components in WKWebView or Android System WebView; native APIs through Capacitor plugins | Heavy component trees, long list rendering, route transitions | Virtual scroll on long lists, frame rate during page transitions, Capacitor plugin call timing |
| Custom native shell with WebView | Native screens mixed with embedded web screens | Slow WebView creation, cookie and session handoff, inconsistent back stack behavior | Transition time from native to web screens, WebView prewarming, state restore after backgrounding |
| React Native | Native UI components driven by JavaScript (the Hermes engine and the JSI based New Architecture in recent versions) | JavaScript thread congestion, excessive rerenders, large lists | JS and UI thread frame rates, list scroll performance, startup with and without Hermes bytecode |
| Flutter | Its own rendering engine draws every pixel (Impeller in recent versions) | Expensive widget rebuilds, shader or raster jank, large images | UI and raster thread timings, first run animation jank, memory on image heavy screens |
A few checks pay off no matter which framework you use:
Use one tool per layer and line the results up by timestamp. The table groups common options by what they measure.
| Tool | Platform | Layer | Best for |
| Chrome DevTools (remote debugging via chrome://inspect) | Android | WebView | JavaScript profiling, long tasks, layout and paint, memory heap snapshots |
| Safari Web Inspector | iOS | WebView | Timelines, JavaScript profiling, and memory for WKWebView content |
| Android Studio Profiler | Android | Native | CPU, memory, energy, and network for the whole app process |
| Perfetto and System Trace | Android | Native and system | Frame timing, startup traces, thread scheduling |
| Xcode Instruments | iOS | Native | Time Profiler, Allocations, Leaks, Energy Log, Animation Hitches |
| Lighthouse | Web | WebView content | Lab audits of the web bundle served to the WebView |
| Appium | Both | Automation | Scripting journeys across NATIVE_APP and WEBVIEW contexts |
| Firebase Performance Monitoring | Both | Field data | Startup, network, and custom traces from real users |
| Sentry or Crashlytics | Both | Field data | Crashes, ANRs, and performance traces in production |
| JMeter, k6, Gatling | Server | Backend | API load while devices run client side tests |
| Real device cloud such as Kobiton | Both | Device and session | Running everything above on many real devices, with session video and device metrics |
Lab tools tell you why something is slow. Field tools tell you whether real users feel it. Use both, and compare lab results from your matrix devices with field data from the same models. If a journey passes its budget in the lab but field data shows slow starts on one particular model, that gap is your signal to add that model to the matrix.
Most hybrid slowdowns trace back to a short list of causes. Match the symptom you measured to its likely cause, then confirm it in a trace before changing any code. Fixing the wrong layer can cost a sprint and introduce new regressions along the way.
| Symptom on the device | Likely cause | Fix |
| Long blank screen after the splash | A large JavaScript bundle parsed on launch; plugins initialized synchronously | Code split by route, defer noncritical plugins, inline critical CSS, and ship assets locally instead of loading them from a remote server |
| Stutter while scrolling a list | Thousands of DOM nodes; images decoded on the main thread | Virtual scrolling, fixed image dimensions, lazy loaded images, smaller thumbnails |
| Laggy animations | Animating width, height, top, or left, which forces layout | Animate transform and opacity only; limit box shadow and blur filters |
| Taps feel delayed | Long tasks from heavy event handlers or state updates | Break work into smaller chunks, debounce input handlers, move heavy work to Web Workers |
| UI freezes when using the camera or files | Large payloads over the bridge, such as base64 images | Pass file paths or URLs instead of raw data, batch bridge calls, use async plugin APIs |
| Memory climbs with every repeat | Detached DOM nodes, timers or listeners never cleared, unbounded caches | Clean up on unmount, cap cache sizes, take heap snapshots before and after a flow |
| App reloads after switching apps | The OS killed the WebView renderer under memory pressure | Reduce the memory footprint, persist UI state, and restore screens quickly on resume |
| Battery drains in the background | Polling timers, GPS, or Bluetooth plugins left running | Pause work on background events, use push instead of polling, release sensors when idle |
| Slow on cellular, fine on WiFi | Many small requests, no caching, large payloads | Bundle requests, add HTTP caching and compression, cache API responses for offline use |
| Slow only on certain Android phones | An older WebView build or aggressive OEM battery limits | Test those exact models, and add a WebView version check with an update prompt where needed |
Performance regressions are cheapest to fix in the pull request that caused them, while the change is still fresh in the developer’s mind. Running a slim performance suite on real devices inside the pipeline turns your budgets into automatic checks instead of surprises in release week.
| Pipeline stage | What runs | Devices | Gate |
| Every pull request | Bundle size check, Lighthouse on the web bundle, 1 to 2 key journeys | 1 midrange Android phone, 1 iPhone | Fail on bundle growth over budget or a cold start regression over 10% |
| Nightly | All critical journeys, plus startup, scroll, and memory checks | The full tiered matrix | Flag any p90 metric that is worse than the baseline by a set margin |
| Weekly | Soak tests, network profiles, battery runs | Budget and midrange tiers | Report trends and open tickets for steady degradation |
| Release candidate | The full suite plus a comparison with the last production release | The full matrix plus new OS betas | Block the release on any budget failure |
A pipeline only helps if the team trusts it. These practices keep it reliable:
Kobiton gives teams the real devices and the measurement layer that hybrid performance testing depends on, without the cost of building and maintaining a physical device lab. Each part of the process in this guide maps to a Kobiton capability.
| What this guide calls for | How Kobiton helps |
| A tiered matrix of real Android and iOS devices | Real device cloud, private cloud, and on premises device options across OEMs, OS versions, and form factors |
| Device side metrics during each run | CPU, memory, network, temperature, and energy drain tracked in real time |
| Analysis after a run | Session review tools that let you go back through memory, CPU, network, battery drain, and temperature after a test finishes |
| Front end response times for each step | Response timing captured automatically, with no hand written start and stop timer code |
| Backend load paired with device runs | Integrations with load tools such as JMeter, k6, and NeoLoad |
| Automated hybrid journeys | Appium, Espresso, and XCUITest scripts running on real devices, including context switching between native and WebView layers |
| Evidence for every failure | Session video, screenshots, gestures, and device logs attached to each run |
| Release gates in the pipeline | CI/CD integrations that trigger performance runs on pull requests, nightly builds, and release candidates |
A typical Kobiton workflow for a hybrid app looks like this:
Metric availability can vary by OS version and device, so check the Kobiton documentation for current support on the platforms in your matrix.
Work through this list before each release and tick off items as your team completes them.
It is the practice of measuring startup time, responsiveness, rendering smoothness, memory, battery, network behavior, and stability for apps that combine a native shell with web content in a WebView. It covers the native layer, the web layer, and the bridge between them.
Native apps run platform code directly. Hybrid apps add a browser engine and a JavaScript bridge on top, so you also need to measure JavaScript execution, DOM rendering, WebView versions, and the cost of bridge calls.
Not for release decisions. Emulators use desktop hardware and skip thermal throttling, memory pressure, OEM battery limits, and real WebView builds. Use them for early functional checks, and use real devices for the performance numbers you act on.
Start with 5 to 8 devices across budget, midrange, and flagship tiers on both platforms, chosen from your own analytics. Expand the set once those devices cover about 80% of your active users.
Chrome DevTools with remote debugging for Android WebViews, and Safari Web Inspector for iOS WKWebView. Pair them with Android Studio Profiler, Perfetto, or Xcode Instruments for native side data.
Script your critical journeys in Appium, switch between the NATIVE_APP and WEBVIEW contexts, add timing marks in both layers, and run the scripts on real devices in your CI pipeline with budgets acting as pass or fail gates.
Yes. Android System WebView updates through the Google Play Store separately from the OS, so your app’s behavior can change without a new app release. Record the WebView version with every result and rerun key journeys after major WebView updates.
Run a slim suite on every pull request, the full journey suite nightly, soak and battery tests weekly, and the full device matrix on every release candidate.
Hybrid apps trade some runtime overhead for faster development, and performance testing on real devices is how you keep that trade working in your favor. The WebView, the JavaScript bridge, and third party plugins all behave differently on every chipset, OS release, and WebView build, so only real hardware shows you what your users actually feel.
Start small. Pick five critical journeys, set budgets for them, build a tiered device matrix from your analytics, and capture a baseline. Then automate those journeys, run them on every build, and let regressions block the merge. Within a few release cycles, that habit turns performance from a launch week scramble into a number your team watches every day.
Ready to run your hybrid app on real devices with device metrics, session video, and CI integration in one place? Start testing with Kobiton.