Jan 14, 2025
A Complete Guide to AI Testing Agents for Software Testing

Frank Moyer
Read More
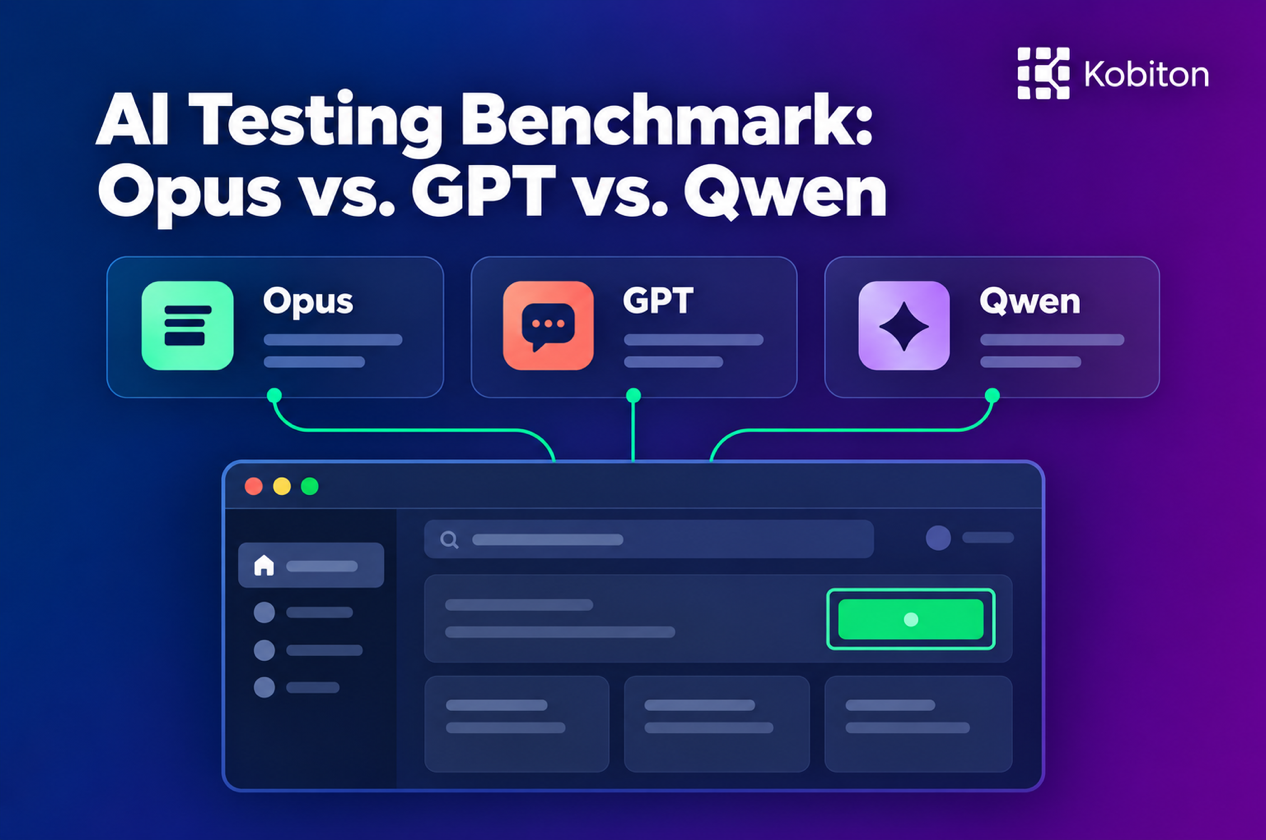
It seems like a new AI testing tool is launched every day. Many promise easier automation, but how reliably can they find the right control? Kobiton’s AI Testing Benchmark compares Opus, GPT, and Qwen across 10,568 human-verified targets.
Consider an AI testing step that says, “Select the scan QR code button.” The model identifies a control and the automation selects it. If it chooses the neighboring button, the next step may fail because the script has already gone off track.
Repeated labels, small icons, and controls nested inside other controls make that choice harder. Testers also describe the same target in different ways. A useful evaluation shows how consistently the model finds the intended control and which conditions cause misses.
Kobiton published the AI Testing Benchmark in a public GitHub repository to measure that consistency. It compares Claude Opus 4.8, GPT-5.6, and Qwen2.5-VL-7B using the same screens, targets, and scoring rules.
GPT-5.6 achieved the highest screenshot localization accuracy in this comparison. Accuracy also changed substantially with the method used to locate a control.
Before automation can click, tap, or type, a locator must find the target. It can use an element’s attributes, a visual description, or its text.
Appium, Selenium, and Playwright primarily locate elements through the application’s exposed structure. On a web page, that is the document object model, or DOM. In a native interface, it is the UI hierarchy and its accessibility information.
A test can match a control’s title, accessibility ID, or role. An XPath query can select a node by its attributes and position in the hierarchy. These frameworks find the element so automation can click, tap, or type into it. None of these lookups requires AI.
Visual navigation uses what appears on the screen to decide where to act. A tester describes a control, such as “the blue button labeled Scan QR,” and AI interprets a screenshot to locate it. This lets testers write steps in terms of what a user sees, without specifying an element ID or XPath.
TestMu AI’s KaneAI accepts descriptions of an element’s color, size, icon, and position. It combines those visual cues with text and accessibility attributes.
A screenshot-based locator can return a bounding box or a point within the target. Automation uses those coordinates to interact with the control. Kobiton’s screenshot benchmark asks for a bounding box and scores its center.
Text matching identifies a control by the text exposed in the UI tree. In Maestro, tapOn: "Scan QR" finds and taps that control. The lookup does not require AI to interpret a screenshot.
Maestro’s readable YAML commands, such as tapOn, inputText, and assertVisible, let testers express actions and checks with little syntax. Maestro Studio can generate those commands when users select elements in the app, helping testers without programming experience build automation.
Maestro uses a defined command vocabulary and matches text in the UI tree. It also supports IDs and other selectors.
Google ARTEMIS combines accessibility hierarchies, text recognition, and visual models. It can use indexed elements and extend to visual or coordinate targeting.
Kobiton’s Appium AI supports both tree and vision strategies. The tree strategy uses AI to turn a natural-language description into a selector. The vision strategy locates a screen region and returns a virtual element for Appium to interact with. The strategy is selected per session.
A planned companion article, How to Choose an Element Locator for Test Automation, will compare the strengths and weaknesses of UI trees, visual AI, and text matching.
Kobiton’s benchmark evaluates the AI part of target selection in three ways:
The tree track scores AI-generated selectors. It does not test supplied Appium, Selenium, or Playwright selectors, or Maestro’s text matching.
These results compare Opus, GPT, and Qwen under the benchmark’s rules. Complete automation products and other hybrid implementations need their own evaluations.
The benchmark contains 841 screenshots and their matching accessibility trees. The published comparisons use 10,568 human-verified elements. Each element has three descriptions:
Each request asks the model to locate the described element. The screenshot track returns a box; the tree track resolves an XPath to a node and uses its bounds. The cascade scores whichever answer its fallback rule accepts.
Centroid correctness checks whether the center of the predicted box falls inside the human-annotated target box. In the visual below, teal marks the target, yellow shows the predicted box, and the dot marks its center. That dot is the click or tap point when automation uses the center of the box.
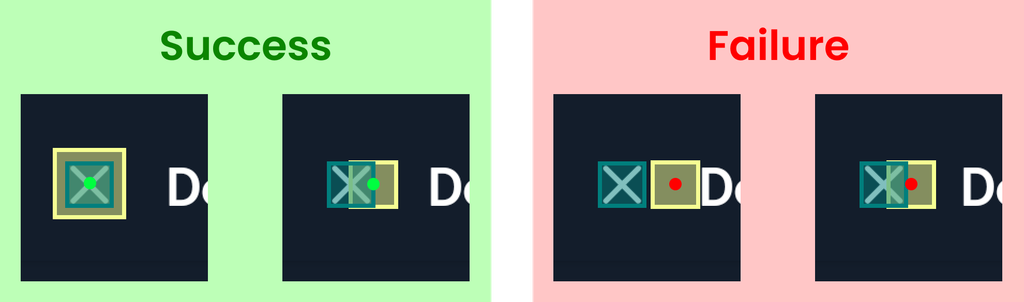
Both examples on the left pass because their green dots fall inside the target. The boxes do not have to line up perfectly. Both examples on the right fail: their red dots fall outside the target, even where the boxes overlap.
Screenshot predictions and the bounds of tree-selected elements use the same scoring rule, so all three approaches are judged by where the proposed action would land. A live test must still confirm that the action produces the expected result.
A planned companion article, How AI Test Automation Accuracy is Measured, will cover confusion matrices, precision, and recall.
The reference screenshot results use the short name description for the same 10,568 elements.
| Model | Centroid correctness |
|---|---|
| Claude Opus 4.8 | 91.3% |
| GPT-5.6 | 96.2% |
| Qwen2.5-VL-7B-Instruct | 84.6% |
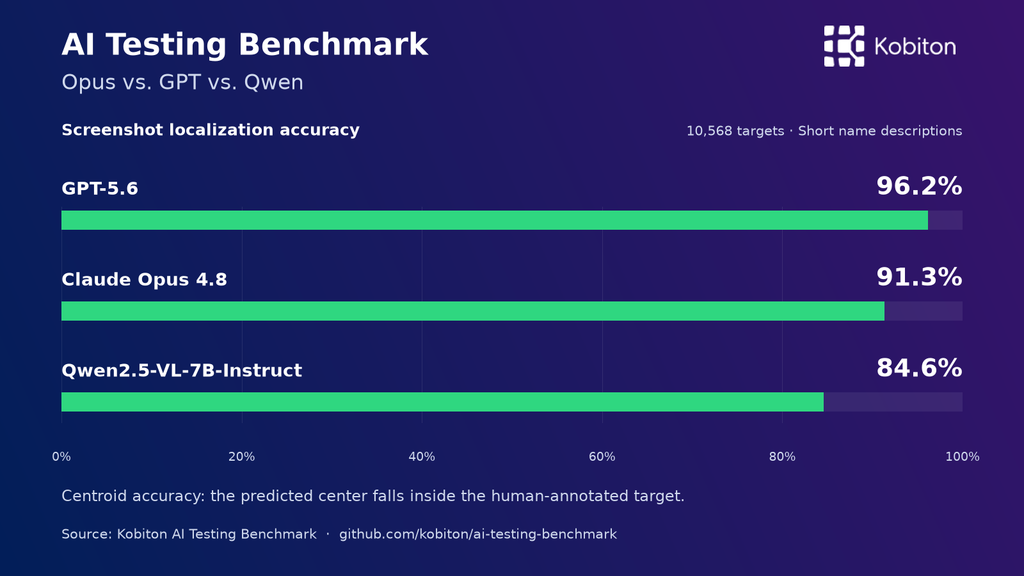
GPT-5.6’s centroid correctness was 4.9 percentage points higher than Opus and 11.6 points higher than Qwen.
In an illustrative batch of 1,000 localization requests at these reported rates, approximately 38 GPT predictions, 87 Opus predictions, and 154 Qwen predictions would fail the centroid criterion.
If you need to serve your own model, use Qwen as a reference and inspect its misses on the controls your tests depend on. A miss on a rarely used icon and repeated misses on checkout controls call for different priorities.
The AI Testing Benchmark also compares screenshot, UI-tree, and tree-first fallback approaches across all three description styles.
| Model | Screenshot | Tree | Tree-first fallback |
|---|---|---|---|
| Claude Opus 4.8 | 92.0% | 57.2% | 87.4% |
| GPT-5.6 | 96.1% | 58.1% | 88.7% |
| Qwen2.5-VL-7B | 86.0% | 35.8% | 81.7% |
This comparison uses three requests per element, rather than the single name description used in the first table. Screenshot scores cover 31,704 requests per model. Tree and cascade scores cover 31,704 for GPT and Opus, and 31,698 for Qwen after six tree errors are excluded.
The captured trees omit keyboard nodes, so they cannot locate a visible keyboard key. Screenshot fallback can supply the missing information.
The cascade accepts an XPath when it matches a node, even if it selects the wrong control. That wrong match blocks screenshot fallback. Across the models, incorrect tree answers account for approximately 9.5 to 10.5% of requests.
All three models scored lower with this cascade than with screenshots alone. That finding applies to the acceptance rule tested here. Systems that validate a proposed target before accepting it, such as ARTEMIS Pro, needs a separate evaluation.
“The QR scanner” gives the model a name. “The blue button labeled Scan QR” adds visual details. “The control that starts scanning my sign-in code” describes the purpose.
In the published phrasing results, Qwen scored 90.17% with the label description and 83.19% with intent.
Qwen averaged 85.99% screenshot centroid correctness across the three phrasings. Only 75.58% of elements passed under all three. The average counts individual requests; the all-three score requires a correct location for every description of an element.
After finding the Scan QR button, the test must activate it and check that the QR-code scanner opened. A disabled button, an overlay, or an application failure can prevent the scanner from opening even when the locator found the right control. The test must then verify that the scanner reads the expected code.
The AI Testing Benchmark measures target selection. Complete workflow tests establish whether those selections lead to the intended outcome.
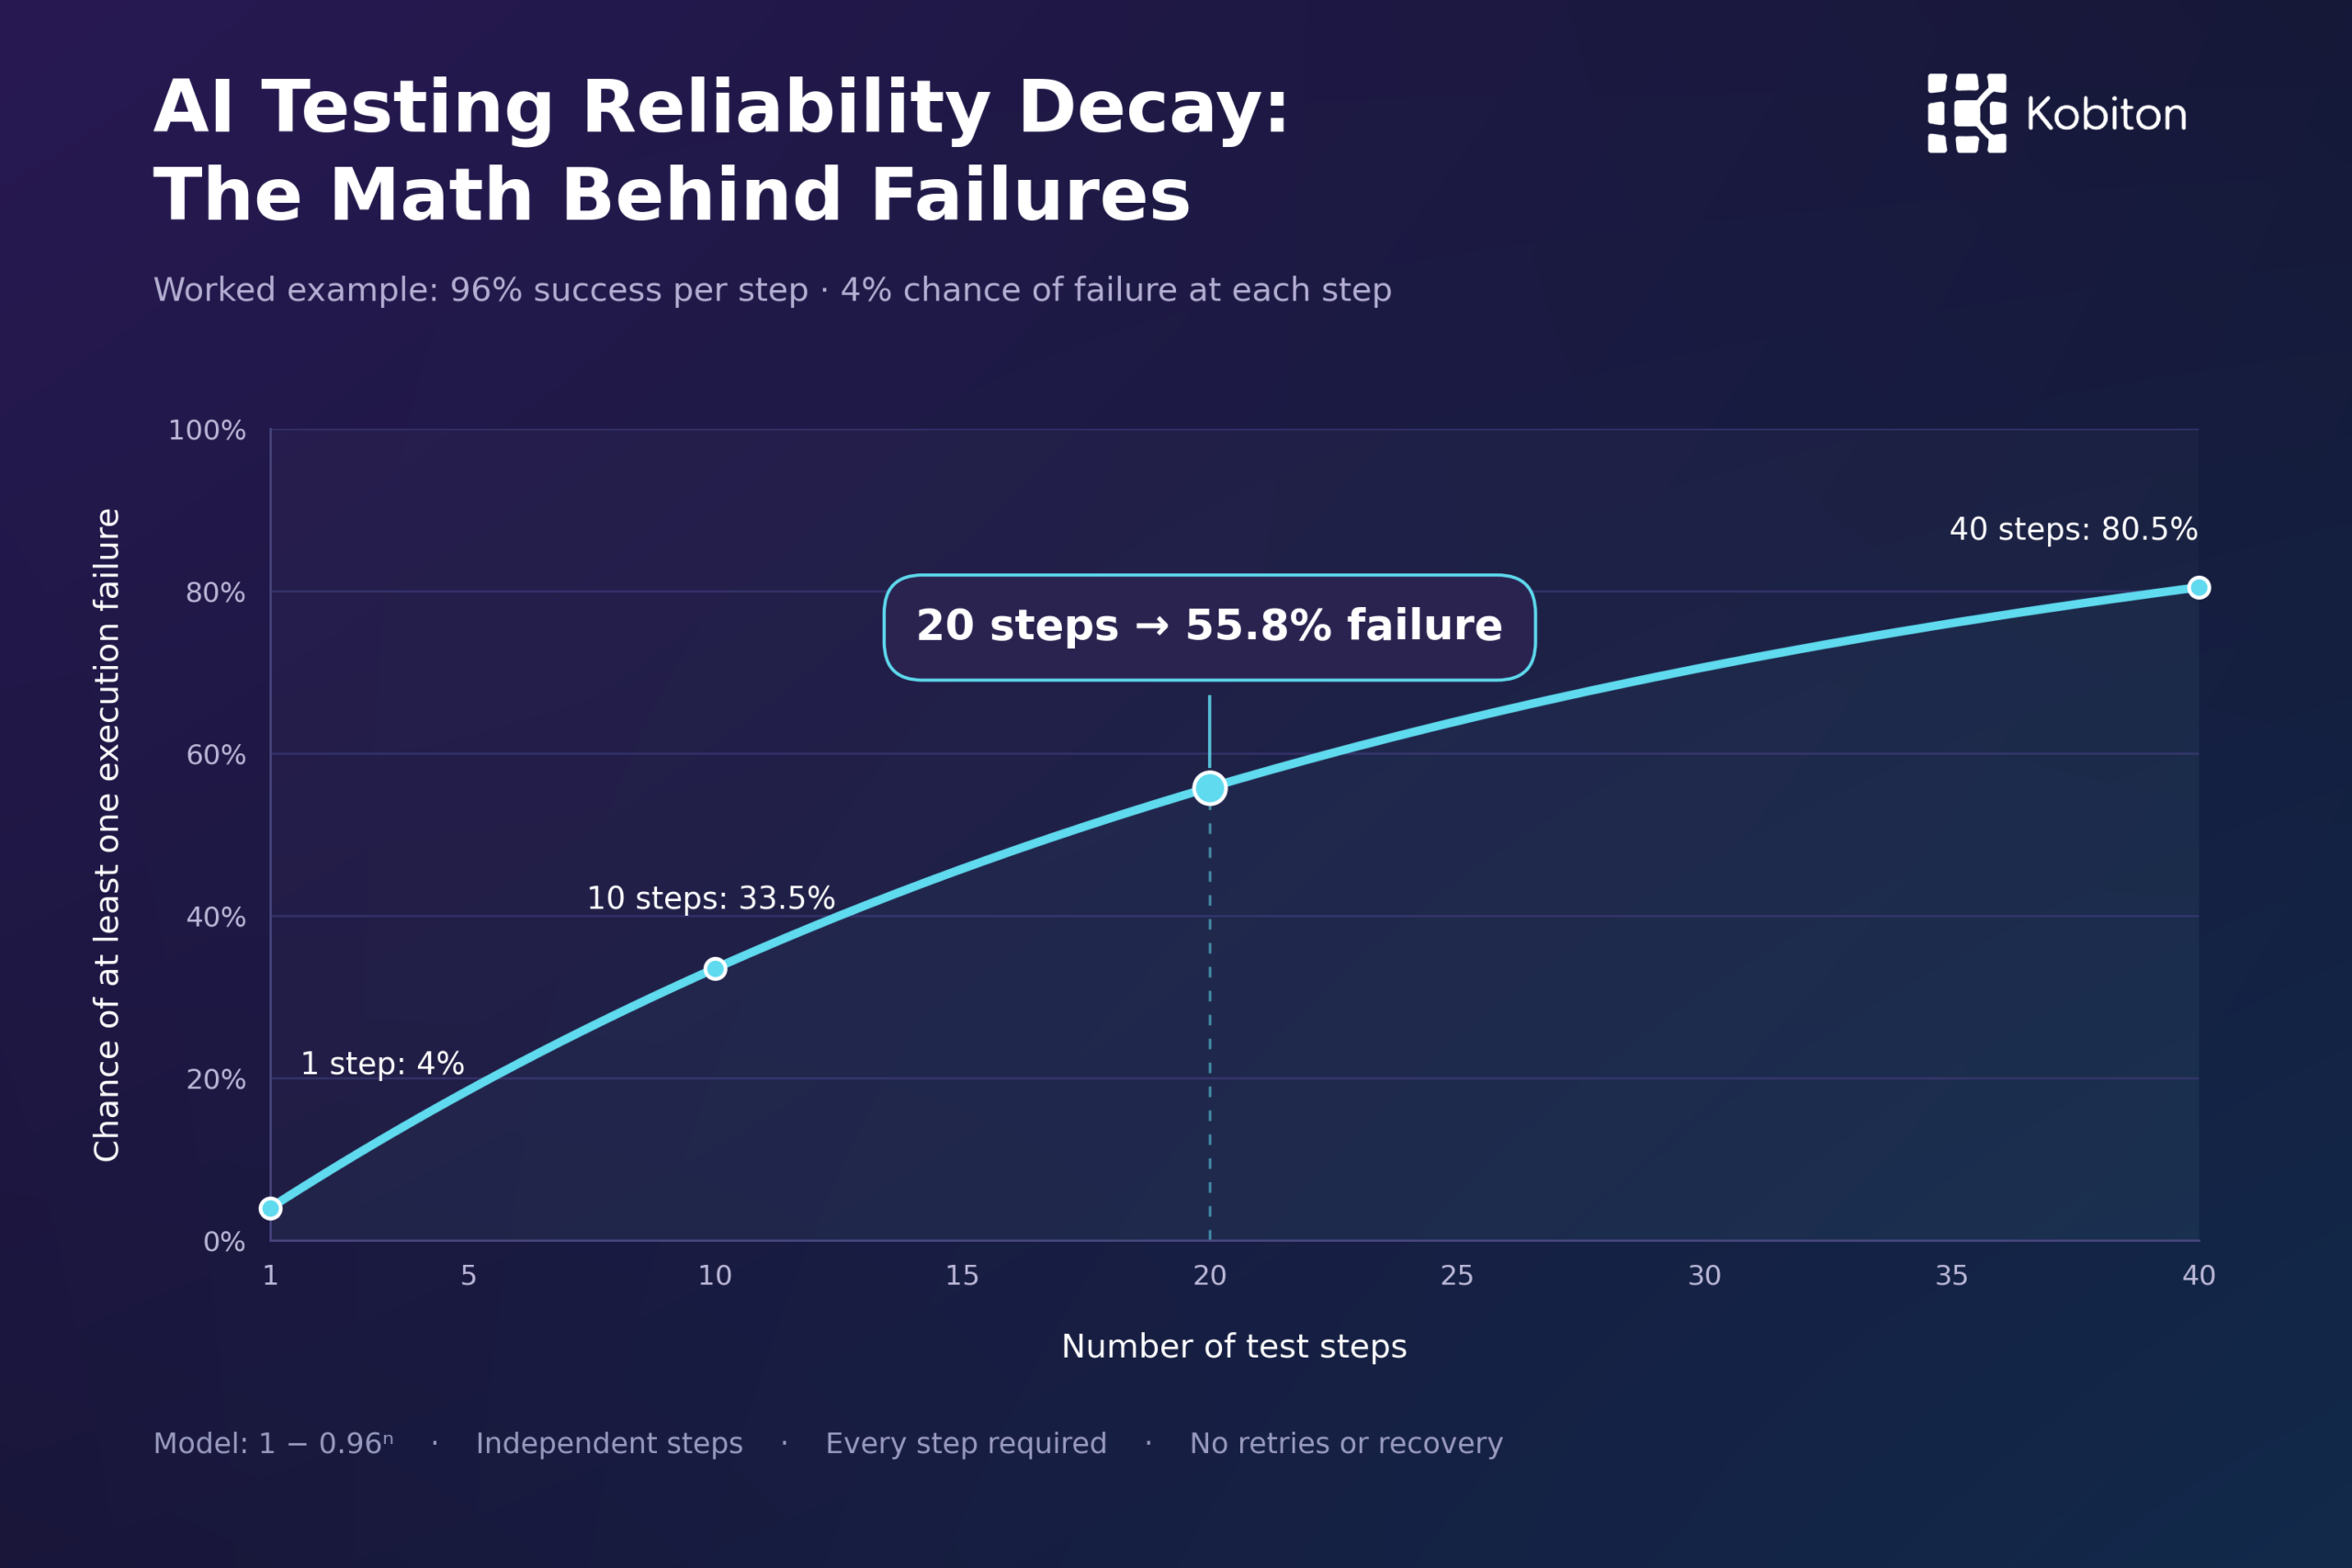
Every required step adds another chance for a test to go off track. In an illustrative model where each step succeeds independently 99% of the time and there is no recovery, twenty required steps yield 81.8% complete-test success.
That execution success rate is an assumption. The benchmark’s localization scores cannot replace a measured per-step execution rate. AI Testing Reliability Decay: The Math Behind Failures explains the mathematics and what it means for test design.
A final pass rate can include recovery from an initial mistake. ARTEMIS Pro gives its operator a chance to recover from blocked or failed actions, so the system may still finish the task.
Record first-attempt success, recovery attempts, and final outcomes separately. Check that a recovered test still satisfies the original test intent.
Take a hypothetical checkout screen with a “Place order” button beside another control. Ask for the button by its text, then by its purpose: “the button that completes the order.” Include a version with a dialog overlapping it. Check the target bounds and predicted point, then run a live test to see whether the action reaches the button and opens the confirmation screen.
The published benchmark asks about targets that are present on screen. If your system must recognize a missing control, add queries for absent targets. Use live tests for loading states, overlays, navigation, and changes between observing the screen and acting on it.
Match the evaluation to the locator: screenshot localization for visual targeting, the tree track for XPath generation, and the cascade for the published fallback rule. Test any additional validation or recovery logic in the system that executes your tests.
Clone the repository, create a Python environment, and install its requirements. Start with a dry run using the comparison population:
python benchmark/run_vision_benchmark.py \
  --dataset data/dataset-v1-human-gpt.jsonl \
--dry-runThen run a small pilot against your OpenAI-compatible endpoint:
python benchmark/run_vision_benchmark.py \
  --dataset data/dataset-v1-human-gpt.jsonl \
  --base-url http://localhost:8000 \
  --model YOUR_MODEL \
  --limit 200 \
--description-index 0 1 2Use your own endpoint and model name. The runner spreads the 200-element pilot across the selected population. The pilot’s scores describe that sample; the reference scores cover the full population.
Record the model, prompt, screenshot resolution, coordinate convention, and description styles. Check the coordinate scale: confusing pixel coordinates with normalized coordinates can send an otherwise valid prediction to the wrong place.
The published tree results use a private prompt that differs from the public default. Running the public prompt therefore tests a different configuration and may produce different scores. See the tree methodology.
Open the results viewer and compare predictions with human annotations. For each miss, check whether the model chose the wrong control, returned an unusable response, or made a coordinate mistake. Use those failures to decide what to change in the model, instructions, or locator strategy.
The companion benchmark video will walk through the model results and a wrong XPath example to show how the fallback rule changes the selected target.
Use the AI Testing Benchmark to evaluate target selection, then run complete workflow tests on your application to confirm that each action produces the intended result.