Mobile is where most revenue-generating traffic now lands, and it’s also where performance problems are least forgiving. A checkout API that responds in 400 ms on a wired office LAN can feel broken on a mid-range Android phone on a congested 4G cell at 6 p.m. Users don’t file bug reports about it they uninstall.
NeoLoad, originally built by Neotys and now part of Tricentis, is one of the most widely used commercial tools for putting mobile back ends under realistic load. This guide covers how NeoLoad mobile performance testing actually works end to end: recording user paths from a real handset, handling HTTPS, cleaning up scripts, modelling realistic device and network populations, running the test, and reading the results.
It also covers something most NeoLoad guides skip: the boundary of what a protocol-level load testing tool can measure on mobile, and what you need alongside it to see the full picture.
What NeoLoad is and where it fits
NeoLoad is a load and stress testing platform that simulates traffic from large numbers of virtual users to measure how an application behaves under pressure. It answers the questions every performance engineer gets asked: how many concurrent users can we serve, where does response time start degrading, and what breaks first.
It was created by Neotys, a French company, and acquired by Tricentis, which now ships it as part of its quality engineering platform. The tool covers web applications, APIs and microservices, mobile apps, and packaged enterprise software such as SAP, Oracle, Citrix, and Salesforce.
Architecturally, NeoLoad splits into a few pieces you’ll interact with constantly:
| Component | What it does |
| Design section | Where user paths (virtual user scripts), populations, and monitors are created |
| Runtime section | Where scenarios execute, with live graphs, errors, alerts, and user counts |
| Results section | Post-test analysis: summary, values, graphs, errors, alerts, logs, details |
| Load Generators | Machines on-premises or cloud that actually produce the traffic |
| Monitoring Agents | Collect infrastructure counters from servers, databases, and network devices |
| NeoLoad Web | Browser-based front end for collaboration, dashboards, trend analysis, and CI results |
A few terms recur throughout the tool and this guide:
- User path the recorded or hand-built sequence of requests representing one type of user’s journey. Older documentation calls this a virtual user script.
- Container a logical grouping of HTTP requests representing one business action, such as “search for product” or “submit payment.”
- Population a group of virtual users assigned a user path, a device or browser profile, and a network profile.
- Scenario the runtime definition: which populations run, how many users, ramp-up, duration, and which load generators are used.
What NeoLoad measures on mobile and what it doesn’t
This distinction determines whether your mobile performance programme is genuinely covered or just partially covered, so it’s worth being precise before touching the tool.
NeoLoad is a protocol-level load testing tool. For every application type it supports on mobile, the mechanism is the same: the app or mobile browser transfers data over HTTP/HTTPS, NeoLoad captures that traffic, and replays it at scale from load generators. It is not running your app binary on a phone thousands of times over.
What that gives you:
- Server and API response times under concurrency
- Throughput, hits per second, and error rates as load climbs
- The breaking point at which the back end degrades or fails
- Infrastructure behaviour under load: CPU, memory, disk I/O, database, network
- The effect of simulated bandwidth, latency, and packet loss on request timing
What it structurally cannot give you:
- App cold and warm launch time on real hardware
- Frame rendering and jank during scrolling or animation
- On-device CPU, memory, battery drain, and thermal throttling
- ANRs, crashes, and memory leaks that surface only after prolonged real use
- OEM-specific behaviour how a Samsung mid-ranger differs from a Pixel or an iPhone
- Rendering and paint time in a WebView or native UI layer
Both halves matter. A back end that holds up at 20,000 virtual users is worth very little if the app takes four seconds to launch on the devices your users actually own. Section 13 returns to this.
Mobile application types NeoLoad supports
Identifying the application type is the first real decision, because it determines the recording method.
Mobile web applications (pure HTML)
Sites accessed through a mobile browser, built to work within mobile browser constraints. They carry ordinary URLs. These are the easiest to record you can often capture them from a desktop browser with device identification enabled, never touching a phone.
Native applications
Software written specifically for a device operating system, compiled against its firmware, and typically adapted per platform. Most native apps talk to a back end through an API that respects the device’s system proxy setting, which is what makes recording possible: NeoLoad positions itself as that proxy and captures the traffic. Native recording works against both a physical device and an emulator, provided the OS supports proxy definition which iOS and Android 4.0 and later do.
Hybrid applications
A web application wrapped in a native shell. The native layer usually handles a thin slice of functionality navigation chrome, biometric or automatic login while the substantive content renders inside an embedded browser component. Because that shared content is reusable across platforms, hybrid apps ship to multiple stores from one codebase. For NeoLoad purposes, treat a hybrid app exactly as you would a native one.
Secured applications
Any of the above communicating over HTTPS. The device correctly interprets NeoLoad’s interception as a man-in-the-middle attempt and refuses the connection until you explicitly authorise it by installing NeoLoad’s root certificate. Section 6 covers this.
Before you record: prerequisites and setup
Get these in place first; most failed first recordings trace back to one of them.
Same network. The NeoLoad machine and the mobile device must sit on the same network, with the device connected over Wi-Fi. Corporate guest networks with client isolation will silently break this. On the device, you may need to disable other network interfaces mobile data in particular so traffic doesn’t quietly route around your proxy.
Know your controller’s IP. You’ll type it into the phone’s proxy or DNS settings. Note it before you start.
Recording port. NeoLoad’s recorder listens on port 8090 by default. Confirm nothing else has claimed it and that host firewall rules permit inbound connections on it.
Quiet the noise. NeoLoad records every HTTP flow passing through the machine, so close other HTTP clients before recording, or configure exclusion rules. Background sync, messaging clients, and OS telemetry all pollute a recording. On the phone itself, background app refresh is a common source of stray requests.
Project naming. Project names accept letters, digits, and underscores only no spaces, dashes, or punctuation.
Environment. Note that some older NeoLoad walkthroughs still circulating online list system requirements from the Windows XP/Vista era and 1 GB of RAM. Ignore those figures entirely and check the current Tricentis documentation for your version; modern controllers and load generators need considerably more, especially for browser-based testing.
Licensing. NeoLoad has historically offered a free tier capped at 50 virtual users, sufficient for smoke tests, CI validation, and confirming monitor and protocol configuration before committing to a full test. Trial and licensing terms change, so verify the current offer with Tricentis rather than trusting older blog posts.
Recording mobile user paths: proxy, tunnel, and device emulation
NeoLoad can capture a mobile application in three ways: from the device itself, from an emulator, or for pure HTML apps from a desktop browser pretending to be a phone.
Recording mode is chosen in the Advanced tab of the Start Recording dialog, where a Modes group box offers Proxy and Tunnel.
Proxy mode (the default choice)
Use this whenever the app honours the device’s proxy setting. It’s simpler to configure and less brittle than the alternative.
- In NeoLoad’s Design section, click Start Recording and open the Advanced tab.
- Select Proxy mode.
- Uncheck Start Client. This matters the mobile device is generating the traffic, so NeoLoad shouldn’t launch a local browser.
- On the phone, open the Wi-Fi network’s settings and set a manual HTTP proxy. Hostname is the NeoLoad machine’s name or IP; port is 8090 unless you changed it.
- Start the recording, then use the app normally on the device. NeoLoad captures the HTTP traffic and builds the user path.
- Group actions into containers as you go, renaming each to describe the business transaction it represents.
- Stop the recording when the journey is complete.
Tunnel mode (when proxy isn’t an option)
Some apps ignore the system proxy entirely, or embed their own networking layer that never consults it. Tunnel mode exists for exactly that case, and it can record essentially any mobile application web, native, standard, or custom on any platform and version.
Instead of acting as a proxy, NeoLoad acts as the web server from the device’s perspective, and separately handles the real requests and responses with the actual back end. The recorder captures the transactions in between.
- Choose Tunnel mode in the Advanced tab and uncheck Start Client.
- Confirm the recording dialog; the tunnel mode wizard appears.
- Click Detect servers to start native application discovery. The detection bar displays the controller’s IP address.
- Without closing that bar, change the device’s DNS server to the NeoLoad controller’s IP so requests reroute through it. Write down the original DNS value first you’ll need to restore it afterwards.
- Exercise the app, then stop the recording and reset the device’s DNS.
Tunnel mode requires administrator rights on the NeoLoad machine and, depending on version, is supported only on Windows and macOS. It’s more involved than proxy mode, so treat it as the fallback rather than the default.
“Identify as” recording without a device
For pure HTML mobile applications, you often don’t need a phone at all. In the Start Recording dialog, tick the Identify as checkbox, click the adjacent three-dot button, and pick the device to emulate from the list of iPhone and Android models. NeoLoad then sends that device’s identifying headers while you record from a desktop browser, and the server returns the mobile experience.
This is faster to iterate on and removes the network configuration entirely. It does not, however, capture native app traffic an emulated user agent is not a native client. Use it for mobile web, not for native or hybrid apps.
Handling HTTPS and secured applications
Almost every production mobile app uses HTTPS, so this section applies to nearly everyone.
To read encrypted traffic, NeoLoad decrypts each message, analyses it, and re-encrypts it before passing it along. That requires certificates. Without the NeoLoad root certificate trusted on the device, the phone sees an untrusted interceptor and refuses the connection correctly.
The certificate. NeoLoad generates a root certificate the first time it launches, named NeoLoad_Root_CA.cer. It lives in the conf subdirectory of the configuration folder in your user profile on Windows, under %appdata%\Neotys\NeoLoad\<version>\conf; on macOS and Linux, under your home directory. The quickest route to it is Help > Open Logs Folder, then navigate up one level into conf.
Installing it on Android. Copy the .cer file to the device over USB or email it to yourself, then install it through the device’s security settings as a trusted credential. Android’s handling of user-installed CAs has tightened substantially in recent releases, which is covered below.
Installing it on iOS. Install the profile, then and this step is routinely missed enable full trust for root certificates in the certificate trust settings. Installing the profile alone is not sufficient; iOS will keep rejecting the connection until full trust is explicitly granted.
Once the certificate is trusted, a secured application can be recorded as a browser-based or native app in proxy mode, or as a native app in tunnel mode.
The modern caveat. Two platform changes limit this approach on current apps:
- Certificate pinning. Apps that pin certificates validate the server’s certificate against a copy baked into the app, and will reject NeoLoad’s certificate no matter what the OS trust store says. You’ll need a debug build with pinning disabled, or a pinning bypass in a controlled test environment.
- Android network security config. From Android 7 onward, apps don’t trust user-installed CAs by default. Unless the app ships a network security configuration that opts into user certificates, recording requires a debug build.
Plan for this. Ask your mobile developers for a recording-friendly build early rather than discovering the problem during a test window.
Turning a raw recording into a reusable script
A raw recording is a transcript of one session with one user’s data. It will not survive replay at scale. Two operations turn it into a real script.
Parameterization varying the input data
Hard-coded usernames, search terms, product IDs, and postcodes make every virtual user behave identically, which inflates cache hit rates and hides real bottlenecks.
In NeoLoad, open the request whose value you want to vary, click the browse button beside the recorded parameter to open the variable picker, then the variable manager, and create a new variable. Choose the File variable type and upload a CSV of test data. Tick the option to treat the first line as column headings, and set the change policy to draw a new value on each iteration. Confirm, and the recorded value is replaced by a ${variable} reference in the request.
Correlation capturing dynamic values from responses
Session IDs, CSRF tokens, ViewState, and order references are issued by the server and change every run. Replaying a captured value produces cascading authentication and validation errors that look like application faults but aren’t.
The workflow: identify the dynamic value in the script, go back to the request whose response first contains it, open Advanced parameters, inspect the recorded response, and find the value with stable left and right boundaries around it. Create a variable extractor on those boundaries, then use search-and-replace to substitute the extracted variable everywhere the hard-coded value appears downstream. Replay the user path in debug mode and confirm the value now varies per iteration.
NeoLoad also ships correlation frameworks for common platforms, which automate much of this for supported technologies.
Everything else worth adding
- Containers named after business transactions, so your results read as “Login,” “Search,” and “Checkout” rather than a wall of URLs.
- Think times between actions, reflecting how long a person actually pauses. Zero think time produces an unrealistically brutal request rate.
- Pacing to control iteration frequency per user.
- Assertions and validations so a fast HTTP 200 containing an error page is recorded as a failure rather than a success.
- Logical actions loops, conditions, delays, and JavaScript blocks for behaviour too complex to express through the drag-and-drop controls.
- Static resource filtering during or after recording, so images, fonts, and stylesheets don’t drown the transactions that matter. Be deliberate here: excluding all static content can understate real bandwidth consumption on mobile networks, which is exactly what you’re trying to measure.
Designing a realistic mobile workload
This is where mobile testing diverges most sharply from desktop web testing, and where NeoLoad earns its licence fee.
Populations
A population is a group of virtual users configured to behave a particular way. Create one from the Population tab in the Design section with the plus button, name it, and configure the panel on the right: user path, percentage of total load, browser, WAN emulation, and cache handling.
Populations let you build a traffic mix that resembles production. A retail app might run 60% of users browsing, 25% searching, and 15% completing a purchase three user paths in one population, weighted by percentage. You can also split by user type: shoppers, admins, and API consumers each getting their own profile.
Device emulation
Click the three-dot button beside Browser and scroll to the bottom of the list, where the iPhone and Android profiles sit. Select the model you want the population to identify as. The same dialog includes a search field and controls for behaviour such as enabling or disabling HTTP/2.
To model a mixed device fleet, create a separate population per device profile and include all of them in the scenario. A common split is roughly proportional to your analytics: current-generation iPhone, current Android flagship, and a two- or three-year-old mid-range Android.
Keep in mind what this emulation is and isn’t. NeoLoad is presenting a device’s identity and connection characteristics to the server. It is not reproducing that device’s CPU, GPU, or memory constraints.
WAN emulation the mobile essential
Testing a mobile back end over an office LAN is the single most common way to produce reassuring, useless results.
Click the three-dot button beside WAN Emulation to open the profile picker. It offers preconfigured profiles across broadband, LAN, mobile, and wireless carrier types, with a search field to find them quickly. Selecting a mobile or wireless profile lets you drill into signal strength good (three bars), average (two bars), or poor (one bar) and sliders let you tune latency and packet loss and adjust upload and download speeds beyond the preset values.
The practical payoff is comparison. Run one population on 3G and another on 4G against the same environment, then compare the metrics side by side. The gaps show you precisely which transactions are network-sensitive and which are server-bound a distinction that’s invisible when everything runs at LAN speed.
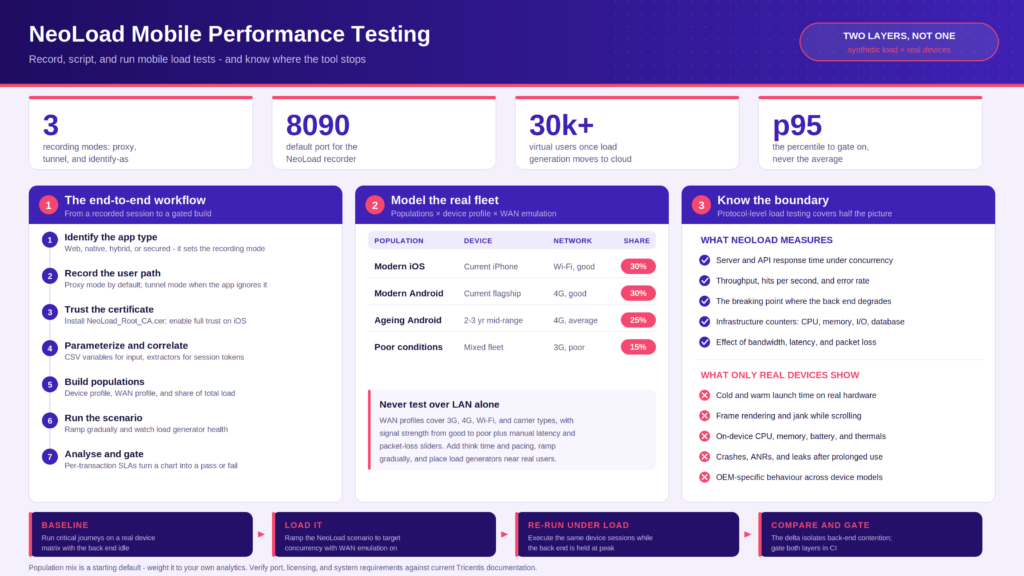
A reasonable default mix for a consumer mobile app:
| Population | Device profile | Network profile | Share |
| Modern iOS | Current iPhone | Wi-Fi / good signal | 30% |
| Modern Android | Current flagship | 4G / good signal | 30% |
| Ageing Android | 2–3 year old mid-range | 4G / average signal | 25% |
| Poor conditions | Mixed | 3G / poor signal | 15% |
Geographic distribution
NeoLoad supports simulating users from different locations through zones and load generator placement, along with IP and network configuration. If your user base spans regions, distribute load generators accordingly rather than firing everything from one data centre the latency difference is often the dominant term in perceived response time.
Running the test: runtime configuration and load generation
The Runtime section holds the scenario: which populations run, how many users, and for how long.
Scenario configuration covers test duration, population load policy, ramp-up and ramp-down timing, iteration counts, and the zones and load generators assigned to each population. Ramp gradually rather than dropping full load instantly you want to see the response time curve bend, not just observe that everything fell over.
Test modes. Normal mode runs the full test with all system resources devoted to generating virtual users. Debug mode validates the user paths defined in the scenario and is what you should use when verifying a freshly correlated script it gives you request and response detail that normal mode doesn’t retain.
Load generation capacity. As a rough planning guide for heavy load tests:
| Virtual user range | Typical infrastructure |
| 1,000–10,000 | On-premises load generators |
| 10,000–30,000 | Cloud load generators |
| 30,000+ | Fully cloud-based generation |
During execution, the Runtime section gives you live visibility:
- Runtime overview virtual users running, error rate per second, alert count, hits per second, and average request response time, plus controller CPU and memory, and per-load-generator hit rate, errors, CPU, memory, and throughput. Watch controller and generator health as closely as application metrics; a saturated load generator produces response time numbers that describe your test rig, not your application.
- Runtime graphs default graphs on first run, customisable mid-test, with settings preserved for subsequent runs.
- Runtime errors per-error detail including time, duration, size, load generator, URL, virtual user, server response, and failed assertion.
- Runtime alerts alerts triggered on performance counters, with time, severity, name, and associated graph.
- Runtime users population and virtual user state in real time, with the ability to change test conditions while the scenario is still playing.
Monitoring the stack during the test
Load numbers without infrastructure counters tell you that something slowed down, not why. NeoLoad’s monitoring covers operating systems, application servers, web servers, databases, network devices, and virtualisation layers, configured through the Monitors area of the Design section.
Counters worth collecting on every mobile back-end test:
- CPU utilisation, per host and per service
- Memory usage and garbage collection behaviour
- Disk I/O and queue depth
- Network throughput and errors
- Database connection pool usage, slow queries, and lock waits
- Application server thread pool saturation
NeoLoad also integrates with APM tools such as Dynatrace and AppDynamics, pulling component-level metrics alongside test data. On a distributed back end, that combination is usually what turns “the checkout API got slow at 8,000 users” into “a downstream inventory service exhausted its connection pool.” Recent versions add automated anomaly detection and root-cause suggestions across rate, error, and duration metrics in NeoLoad Web.
Analysing results, SLAs, and reporting
The Results section aggregates everything computed after the run, with a results drop-down that scopes every panel to a selected test.
| Tab | Contents |
| Test summary | Headline statistics: total duration, throughput, total hits, error count, average response time, plus the main graphs |
| Values | Sortable, plottable elements of the test for quick comparison |
| Graphs | How any statistic evolved across the test duration, plotted per request or transaction |
| Errors | HTTP request error detail |
| Alerts | Alerts triggered on performance counters during the run |
| Logs | Log files from each load generator and monitoring agent |
| Details | Enabled for debug-mode runs or projects containing external data |
SLAs
SLAs are how a test produces a verdict instead of a chart. Define thresholds against KPIs response time, throughput, error rate, and custom counters and NeoLoad evaluates each run against them and reports pass or fail. This is what makes automated pipeline gating possible: a build either meets the performance bar or it doesn’t.
Set SLAs per transaction rather than globally. A 2-second budget may be generous for a search call and far too loose for a tap that should feel instant.
Interpreting the numbers
- Response time track percentiles, not just the average. A 400 ms average hiding a 4-second p95 means a meaningful slice of users is having a poor experience. Watch where the curve inflects as virtual users climb.
- Throughput data moved and requests served per second. Throughput that plateaus while users keep increasing marks your saturation point.
- Error rate errors and failed transactions. A rate that climbs with load usually indicates a resource ceiling: connections, threads, memory, or a downstream dependency.
- Resource utilisation correlate CPU, memory, and disk I/O against the response time curve. The counter that saturates first at the moment response time bends is your bottleneck candidate.
- Comparison across runs comparison reports against a previous baseline are how you catch slow regressions that no single run would flag.
Reporting
Reports can be generated from the results manager, the summary panel, or the command line, and exported to PDF, HTML, XML, and Word. In the UI the path is Tools > Generate Reports, then choose the report type, customise its contents, pick an output format, and finish. Custom graphs, comments, filtered reports, and comparison reports are all supported.
One point worth internalising: performance reporting exists to support technical and business decisions, and the right format depends entirely on who’s reading. An engineering team wants transaction-level percentiles and counter correlation. A release board wants a pass/fail against SLA and a one-line risk statement. Producing the same artefact for both audiences serves neither.
When NeoLoad is used collaboratively, results are pushed to the shared server so other testers can pull them locally necessary if anyone other than the person who ran the test needs to analyse it.
Integrations, CI/CD, and converting functional tests
NeoLoad is designed to sit inside a delivery pipeline rather than beside it.
Version control and as-code. Projects can be managed in Git or SVN with native integration. NeoLoad also supports fully YAML-based projects, which suits API tests and pipeline-as-code approaches, and works with Jenkins pipeline definitions.
CI/CD. Integrations cover Jenkins, Azure DevOps, and other common orchestrators, with automated SLA validation providing the pass/fail gate on each build.
API-first design. Swagger and OpenAPI definitions can be imported by file or URL to scaffold a test scenario matching the API contract much faster than recording when you’re testing services directly.
Converting functional tests. NeoLoad can convert Tricentis Tosca and Selenium functional scripts into performance scripts, reusing work the functional team has already done.
Ingesting other tools’ results. Results from JMeter and Gatling runs can be centralised in NeoLoad so early developer-run tests feed the same analysis and trend views as full-scale tests.
RealBrowser. Alongside protocol-based testing, RealBrowser adds browser-based execution in the same interface, so front-end and back-end timing can be combined in one test. It’s built to be lighter on memory and CPU than older browser-based load tools. Note that this is browser-based, not device-based it addresses web front-end rendering, not native mobile clients.
A note on Rapise. Inflectra’s Rapise historically shipped a NeoLoad integration that converted a functional UI script into a protocol-based NeoLoad scenario by replaying the Rapise test while NeoLoad recorded the resulting HTTP traffic, and could feed client-side UI timings into NeoLoad during a protocol-level load test giving you UI responsiveness at, say, 1,000 concurrent virtual users. It was a genuinely useful pattern. That integration was removed in Rapise 7.0, so if you’re reading older comparison articles that recommend it, the architecture is worth understanding but the specific route is no longer available. The underlying idea measure the client experience while the back end is under synthetic load remains the right instinct, which is what the next two sections are about.
The mobile blind spot: what happens on the device
Everything above measures the server side of a mobile request. Your users experience the client side.
Consider a test that passes cleanly: 15,000 virtual users, p95 API response under 800 ms on a 4G profile, zero SLA breaches. Then the release goes out and support tickets arrive about the app being slow. Both observations can be true at once, because the following happen entirely on the device and never appear in protocol traffic:
- Launch time. Cold start depends on real CPU scheduling, storage I/O, thermal state, and how a specific OEM’s Android build manages processes. A launch that measures 1.8 seconds on an emulator can take four seconds on a real budget device with a full memory footprint.
- Rendering and frame rate. Dropped frames and jank during scroll or animation are invisible to a load generator.
- Memory leaks. Growth that only manifests after twenty minutes of real use won’t show up in a replayed HTTP sequence.
- Battery and thermal behaviour. A change that shaves a second off launch by doing more background work can quietly burn power and trigger throttling which then makes everything else slower.
- Device fragmentation. Samsung, Xiaomi, OnePlus, Google, and Apple handle resources differently. Protocol tests are, by construction, device-agnostic.
- ANRs and crashes under real conditions, especially when the device is juggling background activity.
Emulators don’t close this gap either they’re valuable for fast, cheap early feedback but are worst at exactly the metrics that depend on real silicon: launch time, thermal behaviour, and battery.
Pairing NeoLoad with real-device testing
The complete picture requires both layers: synthetic load against the back end, and instrumented execution on real hardware. Kobiton covers the second layer.
Kobiton is a mobile experience platform built around real devices in the cloud, accessible remotely from anywhere, with cloud, on-premises, and hybrid deployment options. During manual and automated sessions it captures the metrics NeoLoad structurally cannot:
- Step-level front-end response times for every action in a session, without instrumenting your code with start-stop timers. Transitions that exceed a two-second target are flagged automatically.
- Device vitals CPU utilisation, memory usage, network activity, battery consumption, and temperature correlated to specific moments on the session timeline, so a spike lines up with the action that caused it.
- Crash and ANR capture with logs, crash logs, and Appium logs attached to the session.
- HAR network exports for root-cause analysis of the requests the app actually made.
- Coverage across real device models and OS versions, which is where OEM-specific and older-hardware problems surface.
A combined workflow
- Baseline on real devices. Run the critical journeys launch, login, search, checkout on a representative device matrix in Kobiton with the back end idle. Record launch time, step response times, and device vitals.
- Generate load with NeoLoad. Start the scenario built earlier: realistic populations, device profiles, and WAN emulation, ramping to your target concurrency.
- Re-run the device sessions under load. While NeoLoad holds the back end at peak, execute the same Kobiton sessions on the same devices.
- Compare. The delta between baseline and under-load step times isolates back-end contention as experienced by a real client. Device vitals in the same window show whether the app is also spending client-side budget it shouldn’t.
- Gate both in CI. NeoLoad SLAs guard the back end per build; Kobiton device runs guard launch time, step latency, crash rate, and vitals. Neither gate alone is sufficient.
This is the pattern the old Rapise-NeoLoad integration was reaching for, executed on real hardware rather than a desktop UI driver.
Best practices checklist
- Identify the app type first web, native, hybrid, or secured because it determines the recording mode.
- Default to proxy mode; fall back to tunnel only when the app ignores the system proxy.
- Sort the certificate before your test window, including iOS full trust and, for pinned apps, a debug build.
- Close background HTTP clients and set exclusion rules before recording so the script contains only what you intend.
- Name containers after business transactions, not URLs your results will be readable by people who didn’t write the script.
- Parameterize every user-supplied value and correlate every server-issued one. Verify in debug mode before scaling.
- Never test over LAN alone. Always include mobile WAN profiles, including a poor-signal population.
- Model a device mix that matches your analytics, not just current flagships.
- Include think time and pacing. Zero-delay virtual users generate a request pattern no human produces.
- Ramp gradually so you can see where the response time curve bends.
- Set SLAs per transaction and gate the pipeline on them.
- Baseline and compare across runs to catch gradual regressions rather than only outright failures.
- Watch load generator health during the test; a saturated generator invalidates the results.
- Pair every back-end load test with a real-device run so client-side and server-side performance are both covered.
Troubleshooting common NeoLoad mobile issues
| Symptom | Likely cause | Fix |
| No traffic captured in proxy mode | Device and NeoLoad on different networks, or client isolation enabled | Put both on the same Wi-Fi; disable mobile data on the device |
| Traffic captured for browser but not the app | App ignores the system proxy | Switch to tunnel mode |
| Connection refused on HTTPS | Root certificate not installed or not fully trusted | Install NeoLoad_Root_CA.cer; on iOS enable full trust for root certificates |
| Certificate installed but app still refuses | Certificate pinning, or Android network security config excluding user CAs | Use a debug build with pinning disabled or user CAs permitted |
| Recording full of unrelated requests | Other HTTP clients or background sync active | Close clients, disable background refresh, add exclusion rules |
| Script replays fine solo, fails at load | Uncorrelated session tokens, or all users sharing one data row | Add variable extractors; parameterize from CSV with per-iteration values |
| Results look great but users complain | Test ran on LAN speeds, or the bottleneck is client-side | Add WAN emulation profiles; run real-device sessions under load |
| Response times spike mid-test with no server-side cause | Load generator saturation | Check generator CPU, memory, and hit rate; distribute across more generators |
| Nothing recorded for a real-time or streaming feature | Traffic isn’t plain HTTP binary, gRPC, or a custom protocol | Confirm protocol support for your version; consider API-level scripting |
FAQs
Is NeoLoad a mobile testing tool?
It’s a load and performance testing platform that supports mobile applications by capturing and replaying their HTTP/HTTPS traffic at scale. It tests the back end that mobile apps depend on. It does not execute your app on physical devices or measure on-device metrics like launch time, frame rate, or battery use.
What’s the difference between proxy mode and tunnel mode?
Proxy mode routes the device’s traffic through NeoLoad’s proxy on port 8090 and requires the app to honour the device’s proxy setting. Tunnel mode makes NeoLoad act as the web server from the device’s point of view via DNS redirection, so it works even when an app ignores the proxy. Proxy mode is simpler and preferred; tunnel mode is the universal fallback.
Can I test a native iOS or Android app without touching a physical device?
You can record from an emulator using the same proxy configuration. The “Identify as” option lets you record from a desktop browser, but that only produces valid results for pure HTML mobile applications; it emulates a device’s identity, not a native client.
How many virtual users do I need?
Derive it from production analytics: peak concurrent sessions, not total users. Then test above that peak to find the margin. As a capacity guide, up to roughly 10,000 virtual users is typically generated on-premises, 10,000–30,000 with cloud generators, and beyond that fully in the cloud.
Does NeoLoad simulate 3G and 4G conditions?
Yes. WAN emulation provides preconfigured bandwidth, latency, and packet loss profiles for 3G, 4G, Wi-Fi, and carrier types, with signal strength settings from good to poor and manual sliders for finer control.
How does NeoLoad compare to JMeter?
JMeter is free and highly extensible but requires more scripting effort, and historically has offered weaker built-in support for mobile and cloud scenarios, sparser result summaries, and no native run-to-run comparison. NeoLoad provides a GUI-driven design experience, broader protocol coverage including Citrix, Oracle Forms, and SAP, richer analysis and comparison, and commercial support at a licence cost. Many teams run both, using JMeter for early developer tests and centralising the results in NeoLoad.
Can NeoLoad tell me why my app feels slow on an old Android phone?
Only partially. It can tell you whether the back end is responding slowly under load and how network conditions affect request timing. It cannot tell you about CPU contention, memory pressure, thermal throttling, or rendering on that specific device those require running the app on real hardware with device-level instrumentation.
Conclusion
NeoLoad is a strong tool for the job it’s built for: proving that the services behind your mobile app hold up under realistic, network-degraded, device-diverse load. Get the fundamentals right the correct recording mode, a trusted certificate, properly correlated scripts, populations that mirror your real device and network mix, and SLAs that produce a verdict and it will find back-end bottlenecks well before your users do.
What it won’t tell you is how the app feels in someone’s hand. Launch time, frame rate, memory growth, battery drain, and OEM-specific behaviour live on the device, and only real devices measure them honestly.
The teams who ship consistently fast mobile apps run both layers: synthetic load against the back end, and instrumented sessions on real hardware ideally at the same time, so client-side numbers are captured while the back end is genuinely under pressure.
See what your users actually experience. Run your critical journeys on real devices with Kobiton and capture step-level response times, CPU, memory, battery, and crash data alongside your NeoLoad results.
