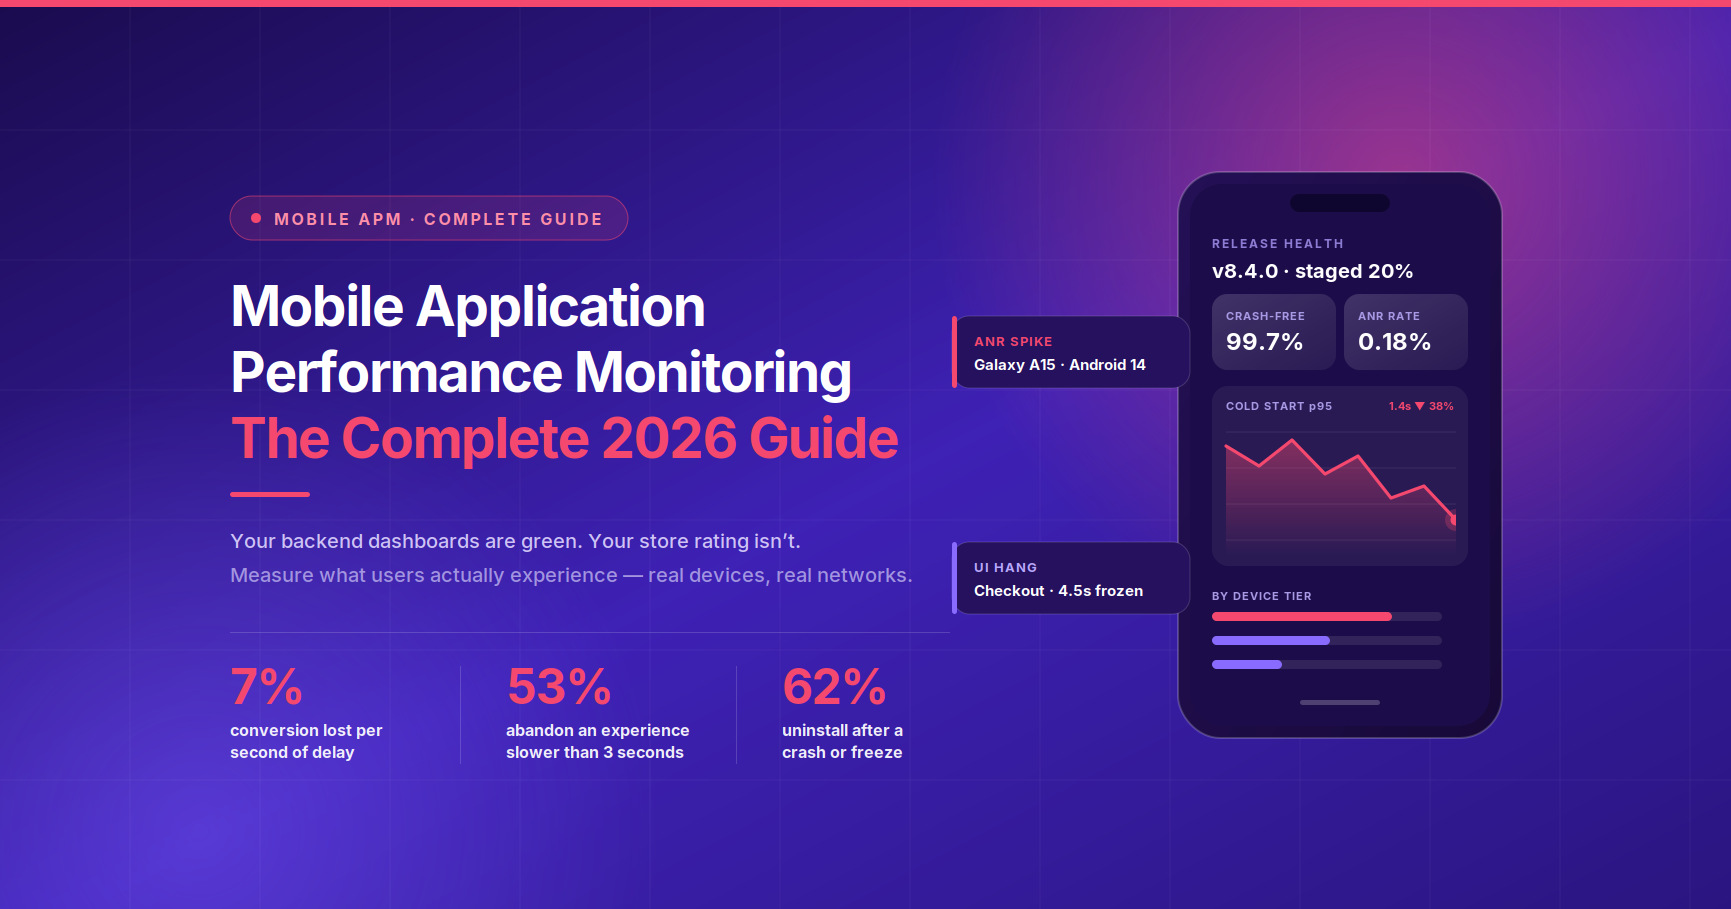
Your backend dashboards are green. Your API p99 is 120 ms. Uptime is 99.98%. And your app store rating just slid from 4.5 to 3.8 because a Samsung Galaxy A-series firmware update pushed cold start past six seconds for a third of your Android users.
That gap between a healthy server and a miserable user is the entire reason mobile application performance monitoring exists as its own discipline. Server-side APM tells you what your infrastructure did. Mobile APM tells you what your user actually experienced, on a mid-range device, on congested 4G, with 12 other apps competing for memory.
This guide covers what mobile APM is, how it differs from traditional and web APM, the metrics that matter (with the specific thresholds the app stores enforce), how instrumentation actually works, the architectural decisions that make or break a rollout, and how to close the loop between production monitoring and pre-release performance testing.
What Is Mobile Application Performance Monitoring?
Mobile application performance monitoring (mobile APM) is the continuous collection and analysis of telemetry from the client side of a mobile app ,the device itself ,to measure how real users experience speed, stability, and responsiveness across the full range of hardware, operating systems, and network conditions in production.
The operative word is client side. A mobile APM platform instruments the app binary so that every session generates a record of what happened on the device: how long the app took to become usable, which screens rendered slowly, which network calls failed, when the main thread froze, how much memory the process consumed before the OS reclaimed it, and what sequence of user actions preceded a crash.
It helps to separate three terms that get used interchangeably:
• Application performance monitoring is the measurement layer. It collects metrics, traces, logs, and events, and it surfaces anomalies against a baseline.
• Application performance management wraps monitoring in a decision-making process: SLOs, error budgets, release gates, capacity planning, and the organizational habit of acting on what the data says. Monitoring tells you the crash rate rose 40%; management is the reason someone owns that number and blocks the release.
• Observability is a property of the system rather than a tool category. An observable app emits enough high-cardinality, correlated telemetry that you can answer questions you did not think to ask in advance ,”why is checkout slow only on Android 13 devices in Brazil on Wi-Fi?” ,without shipping new code.
Classic APM is optimized for known unknowns: you decide in advance which metrics matter and you watch them. Observability is aimed at unknown unknowns. Mature mobile programs use both ,dashboards for the metrics you already track, and traces plus session context for the questions that arise at 2 a.m.
The three components of APM
Gartner’s long-standing framing of APM still maps cleanly onto mobile, and it is a useful way to audit whether your setup has gaps:
1. Digital experience / end-user experience monitoring ,what the user perceives: launch time, screen load, hang duration, interaction latency, crash and ANR exposure.
2. Application discovery, tracing, and diagnostics ,how work flows through the app and out to your services: execution traces, spans, dependency mapping, stack traces, breadcrumbs.
3. Application analytics ,the aggregation layer that turns raw events into trends, cohorts, segments, and prioritization: which issue affects the most revenue-generating users, and is it getting better or worse release over release.
If your stack only does #1, you have a smoke alarm with no floor plan. If it only does #2, you have deep diagnostics but no idea which problems matter.
Why Mobile APM Matters: The Business Case
Mobile performance is not an engineering vanity metric. It sits directly on the revenue path, and the numbers are consistently brutal:
• A one-second delay in response is associated with roughly a 7% drop in conversions.
• Around 53% of users abandon an experience that takes longer than three seconds to load.
• Roughly 62% of users uninstall an app after experiencing a crash or freeze.
Add to that the structural realities of the channel. Your app competes with millions of others in a store where a wave of one-star reviews depresses ranking almost immediately, and where the platform itself penalizes discoverability when stability metrics slip. There is no support engineer standing between a bad release and the user’s opinion of your brand.
The concrete returns of a working mobile APM program:
• Better user experience, measured rather than assumed. You find the slow screens and hidden crashes users never bothered to report, and you know which ones affect enough people to matter.
• Faster mean time to resolution. Full session context ,breadcrumbs, network calls, logs, device state ,removes the investigation cycle where you ship extra logging just to reproduce a bug. Teams that instrument properly routinely cut fix turnaround by half or more, because the diagnosis arrives with the alert.
• Protected store standing. Staying under Google Play’s vitals thresholds keeps you discoverable and keeps warnings off your listing.
• Lower support and engineering cost. Prioritizing by affected-user count stops teams from spending sprints on issues that affect 40 people.
• Reduced churn and higher retention. Performance is the most common non-feature reason users leave, and unlike a feature gap it can be fixed without a roadmap negotiation.
• Evidence-based decisions. Release health data replaces the “does anyone think this feels slower?” conversation with a number that gates a rollout.
Where teams actually use it
• Release validation ,comparing a staged rollout against the previous version before it reaches 100% of users.
• Root cause analysis ,narrowing a spike to a device model, OS build, carrier, or code path in minutes rather than days.
• Crash and ANR triage ,grouping thousands of events into a handful of issues ranked by affected users.
• Flow optimization ,finding the step in onboarding or checkout where latency causes silent drop-off.
• Third-party SDK accountability ,attributing startup regressions to an ad, analytics, or payment SDK you did not write.
• Capacity and launch readiness ,validating client-side experience while the backend is under peak load.
• DevOps and CI/CD feedback ,giving every build a performance verdict instead of a hope.
Mobile APM vs. Web and Server APM: Why It Needs Its Own Playbook
Traditional APM grew up in the data center, where you control the runtime. Web APM added browser-side real user monitoring. Mobile breaks several assumptions that both rely on.
| Dimension | Server / Web APM | Mobile APM |
| Runtime control | You own the server or the browser is standardized | The user owns the device; you control nothing about it |
| Hardware variance | Homogeneous, provisioned | Thousands of device models, from flagship to sub-$100 Android |
| Network | Stable, high-bandwidth, wired | 5G to 2G, captive portals, tunnels, elevators, packet loss, offline |
| Deploy and rollback | Minutes | Days to weeks ,store review, then staged rollout, then user-controlled updates |
| Version fragmentation | One version live | Many app versions and OS versions live simultaneously for months |
| Resource constraints | CPU and RAM are budget items | Battery, thermal throttling, and memory pressure are hard user-visible limits |
| Unique failure modes | 5xx, timeouts, saturation | Crashes, ANRs, watchdog terminations, OOM kills, UI hangs, frozen frames, jank |
| Data collection | Push telemetry freely | Must buffer offline, batch uploads, and stay inside a size, CPU, and battery budget |
| Feedback channel | Internal alerts | Public app store reviews and store-enforced quality thresholds |
Two consequences deserve emphasis.
You cannot hotfix your way out of a mobile performance problem. A bad release is live until the store approves the next one and users update. That makes pre-release detection disproportionately valuable, and it makes staged rollouts plus real-time monitoring non-negotiable.
The app stores are themselves a monitoring system, and they grade you. Google Play’s Android vitals defines explicit “bad behavior” thresholds that affect how discoverable your app is. Exceed them and you lose store visibility ,and may get a warning shown on your listing:
| Android vitals core metric | Overall threshold | Per-device-model threshold |
| User-perceived crash rate | 1.09% of daily active users | 8% of DAU on that model |
| User-perceived ANR rate | 0.47% of daily active users | 8% of DAU on that model |
A user-perceived crash is one that happens while the user is actively engaged with the app. A user-perceived ANR is currently limited to “Input dispatching timed out” ,the five-second input timeout, the kind of freeze the user is unmistakably present for. These are not internal targets you can negotiate. They are distribution constraints, and staying under them is the floor of a mobile APM program, not the goal.
The Metrics That Matter (With Real Thresholds)
Most metric lists are generic. These are the mobile-specific ones, grouped by what they tell you, with the published platform guidance where it exists.
Startup and responsiveness
Cold, warm, and hot start. Cold start means the OS creates the process from scratch; warm start reuses the process but recreates the activity or view controller; hot start just brings an in-memory UI forward. Android vitals flags startup as excessive at 5 s cold, 2 s warm, 1.5 s hot. Apple’s guidance from WWDC is far more aggressive: aim to be ready to use in about 400 ms, roughly the length of the launch animation. Treat the Android numbers as the “you are in trouble” line and the Apple number as the target.
Measure both Time to Initial Display (TTID) ,first frame ,and Time to Full Display (TTFD) ,actually interactive. Shipping a fast skeleton screen improves TTID and hides nothing if TTFD is still four seconds; users judge you on TTFD.
UI hangs and jank. A hang is the main thread blocked long enough for the app to stop responding to input. Apple’s on-device hang detection starts at a 250 ms threshold and MetricKit reports a hang rate in seconds of hang per hour of use. On Android the analogues are slow frames (rendering over the frame budget) and frozen frames (over ~700 ms), plus ANRs at the extreme. UI hangs are the single most under-monitored mobile metric ,they rarely produce an error, so crash-only tooling is blind to them, and they are exactly what users mean when they say an app “feels slow.”
Stability
• Crash-free session rate and crash-free user rate. Report both. Session rate flatters you if a few users crash repeatedly; user rate flatters you if crashes cluster in long sessions. Healthy consumer apps target ≥99.5% crash-free sessions; ≥99.9% is achievable for mature apps.
• ANR rate (Android) and watchdog / hang terminations (iOS). The OS killing your app because it stopped responding is a crash from the user’s point of view, even when it does not produce a conventional stack trace.
• Out-of-memory terminations. Silent on most tooling. Detected by inference ,a session that ends without a crash report, a foreground exit, or a user-initiated close.
• Handled vs. unhandled exceptions. A caught exception that leaves an empty screen behind is a user-visible failure even if it never appears in a crash dashboard.
Network
Mobile network monitoring has to be measured from the client, not from the load balancer. The client number includes DNS, TLS handshake, radio wake-up, carrier latency, retries, and payload deserialization ,all invisible server-side.
Track per endpoint: request count, error rate split into client-side failures (timeouts, no connectivity, cancelled) and server-side failures (4xx/5xx), request and response payload size, and latency at p50/p90/p95/p99. Group similar URLs into patterns so /users/8823/cart and /users/1177/cart aggregate instead of fragmenting your dashboard.
Averages lie in mobile more than anywhere else, because the distribution is bimodal ,good network and bad network are different populations. Always look at percentiles.
Screens, flows, and business outcomes
• Screen load time and screen render time per view, with visit counts and throughput so you know which slow screens actually get traffic.
• Custom traces / execution traces around the flows that make you money: sign-in, search, add-to-cart, checkout, upload, sync. Instrument the business transaction, not just the HTTP call.
• Apdex score. A single 0–1 index that buckets every measured interaction as satisfied, tolerating, or frustrated against a threshold you set. Its value is organizational: one number a product manager, an SRE, and an Android engineer can all argue about productively. Compute it per trace as well as app-wide.
• Flow completion and drop-off. The strongest signal in mobile APM is often an absence of errors: a checkout step where 18% of users vanish with no exception logged. Only tracing plus session context finds that.
Traffic, throughput, and availability
• Throughput ,requests or transactions per minute, per screen and per endpoint. Slowness at 10 requests/minute and slowness at 10,000 are different problems with different fixes.
• Availability from the client’s perspective ,the share of sessions in which your critical API was reachable and returned successfully. This is almost always worse than your server-side uptime figure, because it includes DNS failures, captive portals, carrier issues, and TLS problems your load balancer never sees.
• Session count, session duration, and active users ,the denominators for every rate above, and the context for whether a drop in errors is a fix or a drop in traffic.
• Churn and user-termination rate ,how often users force-quit the app, which is the closest thing to a direct frustration signal you can measure.
Device and resource health
CPU utilization, memory footprint against the device’s limit, battery drain attributable to your process, thermal state and throttling, disk I/O, and app size. These matter because the OS enforces them: sustained CPU triggers thermal throttling, memory pressure triggers termination, and battery drain triggers uninstalls.
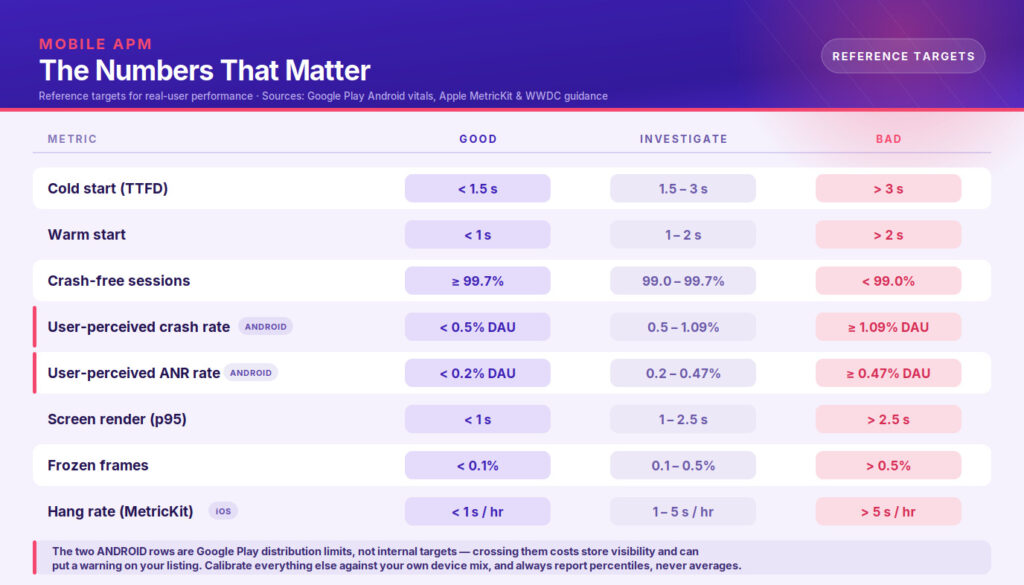
Reference targets
| Metric | Good | Investigate | Bad |
| Cold start (TTFD) | < 1.5 s | 1.5–3 s | > 3 s (Play flags ≥ 5 s) |
| Warm start | < 1 s | 1–2 s | > 2 s |
| Crash-free sessions | ≥ 99.7% | 99.0–99.7% | < 99.0% |
| User-perceived crash rate (Android) | < 0.5% DAU | 0.5–1.09% | ≥ 1.09% DAU |
| User-perceived ANR rate (Android) | < 0.2% DAU | 0.2–0.47% | ≥ 0.47% DAU |
| Screen render (p95) | < 1 s | 1–2.5 s | > 2.5 s |
| API latency from client (p95) | < 1 s | 1–3 s | > 3 s |
| Frozen frames | < 0.1% of frames | 0.1–0.5% | > 0.5% |
| Hang rate (iOS, MetricKit) | < 1 s/hour | 1–5 s/hour | > 5 s/hour |
Treat these as starting points. Calibrate against your own device mix and your own conversion data ,a two-second search on a travel app costs more than a two-second settings screen.
How Mobile APM Works: From SDK to Insight
1. Instrumentation
You add an SDK to the app: native Android (Kotlin/Java) and iOS (Swift/Objective-C), or a wrapper for React Native, Flutter, Unity, .NET MAUI, or Cordova. The SDK hooks platform lifecycle callbacks, the networking stack (URLSession, OkHttp), the rendering pipeline, and the exception and signal handlers. Most of this is automatic; you add manual spans for business-critical flows.
For teams that want to avoid lock-in, OpenTelemetry now has client-side SDKs for Android, iOS/Swift, and the browser. OpenTelemetry Android auto-instruments activity and fragment lifecycle, ANR detection, crash reporting, slow and frozen frame rendering, startup timing, network change detection, and HTTP calls, with session management and offline disk buffering. Emitting OTLP means the same telemetry can go to a vendor today and a different backend tomorrow, and it makes correlating a mobile span with a backend span a matter of propagating one trace context header. The client-side ecosystem is younger than the server-side one, so verify signal-by-signal stability before betting a migration on it.
2. Collection under mobile constraints
This is where mobile APM engineering diverges sharply from server APM. A well-built agent must:
• Buffer offline and batch uploads. Sessions on the subway must survive to be reported later.
• Stay inside a resource budget. A performance monitoring SDK that measurably drains battery, inflates binary size, or adds startup latency is a self-defeating instrument. Look for published overhead figures and verify them on a low-end device.
• Handle sampling honestly. Sampling at 10% is cheap and hides the long tail ,and in mobile the long tail is the problem, because it correlates with specific device models, OS builds, and regions. Prefer full capture for stability signals and errors; sample high-volume traces if you must, but keep the sampling decision consistent within a session so traces are not orphaned.
• Strip PII at the source. Screen names, URL query strings, breadcrumbs, and screenshots leak personal data fast. Redact on-device, before upload, and document it for GDPR, CCPA, and store privacy manifests.
3. Correlation and baselining
The backend joins client telemetry into sessions and traces, then attaches dimensions ,app version, OS version, device model, carrier, connection type, region, locale, cohort, and user or account tier. It establishes a baseline from historical behavior so “3.2 s cold start” becomes “cold start is up 60% versus the last release, concentrated on Android 14.”
4. Detection and alerting
Static thresholds catch known limits (Apdex below 0.85, crash-free sessions below 99.5%). Anomaly detection catches drift you did not anticipate. Release-comparison alerts are the highest-value type in mobile: fire when a new version’s metrics regress against the previous one, during the staged rollout, while you can still halt it.
5. Diagnosis
Good tooling gets you from an aggregate to a single reproducible case: the stack trace, the device and OS, the breadcrumb trail of user actions, the network calls in flight, the memory curve, and the log lines from that session. The measure of an APM platform is how few clicks separate “crashes are up” from “here is the line of code and the three device models it affects.”
6. Act, verify, repeat
Fix, ship, and watch the same metric on the new version. Monitoring without a closed verification loop is just data collection.
Building the Views: Dashboards and Segmentation
Aggregate numbers hide mobile problems, because mobile problems are almost always segmented. The dashboards worth building:
• Release health. Adoption curve, crash-free rate, ANR rate, startup time, and Apdex for the current version versus the previous one. This is the single most-used view in a mature mobile team.
• Geography and carrier. Response time and throughput by country, region, and carrier. A world map with Apdex per region surfaces localized problems ,a CDN edge, a regional API, a carrier doing transparent proxying ,that a global average erases.
• Device model and OS version. The fastest route to root cause. Concentration in one model or OS build usually means a driver, a memory limit, or a platform behavior change, not your business logic.
• Transactions and screens. Every trace with response time, throughput, call count, and Apdex, sorted by traffic × slowness so you fix the expensive ones first.
• Crash and ANR analytics. Crash count over time, grouped by issue, with affected user counts, device and OS breakdown, and full stack traces. Issue-level grouping matters more than raw counts: 40,000 crashes from one bug is one afternoon of work.
• Connection type. Wi-Fi versus 5G versus 4G versus 3G, because the same code path can be fine on one and unusable on another.
Best Practices for Mobile Application Performance Monitoring
1. Define SLOs and error budgets before you pick a tool. “Improve performance” is not a target. “p95 cold start under 2 s and crash-free sessions above 99.6%, measured on our top 20 device models” is. Attach an error budget so the team knows when to stop shipping features and fix reliability.
2. Instrument business flows, not just infrastructure. Nobody churns because CPU hit 70%. They churn because checkout took nine seconds. Put custom traces around the flows tied to revenue and retention, and give each its own Apdex threshold.
3. Profile and benchmark, don’t just monitor. Monitoring tells you that startup regressed. Profilers ,Android Studio Profiler, Xcode Instruments, Perfetto, Macrobenchmark ,tell you which method is responsible. Benchmark every release against the previous one and against competitor apps on the same hardware, so you have a reference point rather than a raw number.
4. Measure on real devices, in both pre-production and production. Emulators and simulators run on desktop-class CPUs with unlimited power and perfect networks. They cannot reproduce thermal throttling, GPU driver differences, carrier latency, low-memory kills, or the OEM skins and background services that consume a real device’s resources. Any performance figure from an emulator is a lower bound on your problems, not a measurement.
5. Test the network conditions your users actually have, not the one in your office. Build a matrix: 5G, 4G, saturated 3G, weak Wi-Fi, captive portal, airplane mode mid-request, and network handover. Most mobile “bugs” filed as crashes are unhandled connectivity edge cases.
6. Use percentiles and segments; distrust averages. Report p50, p90, p95, and p99. Then slice by device tier, OS version, and region. An average that looks fine while your low-end Android cohort suffers is the most common way mobile teams miss a problem for a full quarter.
7. Capture complete session context. When an issue appears, the question is immediately “what was the user doing?” Breadcrumbs, network calls, logs, and state transitions from the whole session are what turn a stack trace into a fix. This is the strongest argument against aggressive sampling.
8. Tune alerts to protect attention. Alert on user-facing symptoms and on release regressions. Group related incidents, set thresholds from your baseline rather than from vendor defaults, route to the team that owns the code, and delete any alert nobody has acted on in a quarter. Alert fatigue is a monitoring failure, not a people problem.
9. Close the loop with qualitative feedback. App store reviews and support tickets describe symptoms vaguely ,”app is slow,” “crashes when I pay.” A mobile APM platform that lets you locate the actual session behind a complaint converts a one-star review into a specific defect. Correlate review sentiment and uninstall spikes against release health.
10. Gate releases on performance in CI/CD. Run performance and stability checks on every build against real devices, fail the pipeline on regression, and carry the same metric definitions from CI into production so pre-release and post-release numbers are comparable. Then use staged rollouts ,1%, 5%, 20% ,with automated halt criteria.
11. Correlate client telemetry with backend traces. Propagate a trace ID from the device through your services. Without it, every slow-request investigation begins with an argument about whether it is a mobile problem or a backend problem.
12. Budget for the SDK itself. Track your monitoring overhead as a metric: added binary size, added startup time, CPU, and battery. Review it every release.
Common Challenges and How to Solve Them
| Challenge | Why it happens on mobile | What to do |
| Device and OS fragmentation | Thousands of models, multiple live OS versions, OEM customizations | Segment every metric by model and OS; maintain a tiered target-device list from your own analytics; test pre-release on real devices spanning that list |
| Data volume and cost | Full-fidelity telemetry from millions of sessions | Full capture for stability and errors, tiered sampling for high-volume traces, short retention for raw sessions and long retention for aggregates |
| Sampling blind spots | 10% sampling hides device-specific long tails | Never sample crashes, ANRs, or errors; keep sampling consistent within a session |
| Alert fatigue | Static thresholds copied from defaults | Baseline-relative thresholds, incident grouping, symptom-based alerting, quarterly alert pruning |
| Slow release cycle | Store review plus user-controlled updates | Feature flags and remote config to disable a bad path without a release; staged rollouts with halt criteria; strong pre-release gates |
| No pre-production signal | Performance validated only after launch | Real-device performance tests in CI with the same metric definitions used in production |
| Privacy and compliance | Session data, URLs, and screenshots contain PII | On-device redaction, allowlists for captured attributes, documented data flows, regional data residency |
| SDK overhead | The agent competes with the app for resources | Measure overhead on a low-end device; treat size, startup, and battery cost as release-blocking metrics |
| Fragmented tooling | Separate crash, analytics, network, and backend tools | Consolidate onto correlated session data, or standardize on OpenTelemetry so signals join on shared IDs |
| Ownership gaps | Mobile sits between product, QA, and platform teams | Assign named owners per SLO; put release health in a review the whole team sees |
Mobile APM Tooling: Categories and How to Choose
The market splits into four categories that are frequently compared as though they were interchangeable:
• Mobile-first observability platforms (Embrace, Instabug/Luciq, Firebase Crashlytics + Performance Monitoring, Sentry, Bugsnag) ,deep client-side fidelity: crashes, ANRs, hangs, session replay, custom traces.
• Full-stack APM suites with mobile RUM modules (Datadog, Dynatrace, New Relic, AppDynamics, Site24x7) ,strongest when you need client telemetry stitched to backend traces and infrastructure in one place.
• Open-source and standards-based stacks (OpenTelemetry SDKs with Grafana, Jaeger, Prometheus, or ClickHouse) ,maximum control and no per-seat lock-in, at the cost of running the pipeline yourself.
• Real-device testing and pre-production performance platforms (Kobiton and peers) ,catch regressions before the store does, on real hardware, which production monitoring by definition cannot do.
Most serious mobile programs run one from the production monitoring group and one from the pre-production group. They answer different questions.
Evaluation criteria
4. Mobile-native signal coverage. Does it capture ANRs, UI hangs, frozen frames, OOM terminations, and startup phases ,or just crashes and HTTP calls? Crash-only tooling marketed as APM is the most common mismatch.
5. Sampling policy and data fidelity. What percentage of sessions is retained, and what is dropped first under load?
6. Framework support. Native plus the cross-platform stack you actually use, with symbolication and source maps for it.
7. Overhead, published and verifiable. Binary size, startup cost, CPU, battery.
8. Segmentation depth. Can you slice by device model, OS build, carrier, connection type, region, and app version simultaneously without pre-aggregating?
9. Time to root cause. From alert to stack trace, session timeline, and offending code ,measure this in a trial with a real incident.
10. Backend correlation. Trace context propagation, or an integration with the APM you already run.
11. CI/CD and release integration. Build metadata, release comparison, staged-rollout awareness, pipeline gates.
12. Standards support. OTLP export and OpenTelemetry compatibility as an exit strategy.
13. Privacy controls. On-device redaction, data residency, retention configuration, subprocessor transparency.
14. Cost model. Per session, per user, per event, or per host ,model it against your peak month, not your average one.
15. Alerting and workflow fit. Slack, PagerDuty, Jira, and the ability to route by code ownership.
Run a bake-off on a real incident rather than a demo dataset. The differences that matter only appear when you are trying to answer a question under pressure.
Where Pre-Production Performance Testing Fits ,and Where Kobiton Comes In
Every production monitoring tool shares one structural limitation: it can only tell you about a regression that has already shipped to users. On mobile, “already shipped” means days of store review and weeks of update adoption before a fix reaches everyone. The cheapest performance defect is the one that never reaches the store.
That is the gap Kobiton is built to close. Kobiton runs your app on real devices in a cloud device lab ,actual phones and tablets, not emulators ,so the numbers you collect reflect real CPUs, real GPUs, real thermal behavior, real memory limits, and real network paths.
What that provides alongside a production APM:
• Real-device performance measurement. Front-end response times captured at roughly 35 ms accuracy, with automatic flagging of transitions that exceed a target such as two seconds between test steps.
• Device-level metrics during test execution. CPU utilization, memory usage, network activity, device temperature, and energy consumption, captured while your test drives the app ,so you can attribute a slow screen to memory pressure or thermal throttling rather than guessing.
• Crash detection with full session context. Session Explorer keeps logs, screenshots, and contextual data from each run, so a failure found in CI arrives with the evidence needed to fix it.
• Load testing correlation. HAR export and integrations with NeoLoad, JMeter, k6, and Grafana let you measure client-side experience while the backend is under load ,the scenario that breaks apps on launch day and that neither pure load testing nor pure client monitoring captures alone.
• Broad device coverage on demand. Test across the device and OS matrix your production analytics say your users actually run, including the low-end and older-OS segments where performance problems concentrate.
• Automation framework support. Appium, Espresso, and XCUITest scripts run against the device cloud, which is what makes performance a CI gate rather than a manual pre-release ritual.
The workflow that works: use production mobile APM to learn which devices, OS versions, screens, and flows are hurting real users, then encode those exact conditions as automated real-device performance tests in your pipeline so the same regression cannot ship twice. Production monitoring supplies the priorities; real-device testing supplies the prevention.
A 90-Day Implementation Roadmap
Days 1–30 ,Instrument and establish truth. Integrate the SDK across your platforms and frameworks. Verify symbolication and source maps. Set up on-device PII redaction. Ship to internal builds, then to production behind a staged rollout. Collect two to four weeks of baseline data before you set a single threshold. Build the tiered device list from your own analytics.
Days 31–60 ,Define targets and instrument what matters. Add custom traces to your top five revenue and retention flows. Set Apdex thresholds per trace. Write SLOs with error budgets for startup, crash-free rate, ANR rate, and the critical flows. Build the release health, device/OS, geography, and crash analytics dashboards. Configure baseline-relative alerts and route them by ownership.
Days 61–90 ,Close the loop. Wire release-comparison alerts into the staged rollout process with explicit halt criteria. Add real-device performance tests to CI covering the conditions your production data flagged, and gate merges on regression. Propagate trace context from client to backend. Run one blameless review of a real incident and fix whatever made diagnosis slow. Start the monthly cadence: review release health, prune alerts, re-baseline targets.
Frequently Asked Questions
How is mobile APM different from mobile analytics?
Analytics answers what users did ,screens viewed, funnels, retention. APM answers how well the app performed while they did it. They overlap at drop-off: analytics shows users abandoning checkout, APM shows the 4.5-second hang that caused it. Run both and correlate them.
Does a monitoring SDK hurt performance or battery life?
A well-engineered agent is designed to be lightweight and non-intrusive, with minimal impact on app size, battery, and runtime. But “minimal” is a vendor claim until you measure it. Benchmark binary size, cold start, CPU, and battery drain with and without the SDK on a low-end device, and re-check after every SDK upgrade.
Can mobile APM replace performance testing?
No. Monitoring observes production; testing validates changes before they reach production. On a platform where rollback takes weeks, you need both ,and the two should share metric definitions so a CI number and a production number mean the same thing.
Should I sample sessions to control cost?
Never sample crashes, ANRs, or errors ,the long tail is exactly where device-specific problems live. Sampling high-volume performance traces is reasonable if the decision is consistent within a session so traces are not orphaned. Control cost with retention tiers instead: short retention for raw session data, long retention for aggregates.
What’s the single most under-monitored mobile metric?
UI hangs. They produce no exception, so crash-reporting tools never see them, and they are precisely what users describe as an app “feeling slow.” Track hang rate on iOS and frozen frames plus ANRs on Android.
Which platforms and frameworks should the tooling cover?
Native Android and iOS at minimum, plus whichever cross-platform framework you ship ,React Native, Flutter, Unity, or MAUI ,with working symbolication for each. Cross-platform apps need extra scrutiny: many tools capture the native crash but lose the JavaScript or Dart stack frame that actually explains it.
How do I get engineering time allocated to performance work?
Tie the metric to money. Report cold start next to conversion rate, crash-free rate next to uninstall rate, and checkout Apdex next to completed orders. A performance number attached to a revenue number gets prioritized; a performance number on its own gets deferred.
