
Every mobile app has a limit. The question is never whether your app will hit it, but when, where, and whether you’ll be the one to discover it, or your users will. A checkout flow that hums along for 10,000 concurrent shoppers can buckle at 12,000. A media app that streams flawlessly on Wi-Fi can spiral into memory errors on a congested 3G connection. A perfectly optimized client can still stall because a third-party payment gateway slows to a crawl under load.
Stress testing exists to find those limits deliberately, in a controlled environment, before a product launch, a viral moment, or a holiday rush finds them for you. This guide walks through what mobile app stress testing is, why apps break under pressure, and, most importantly, a repeatable, quantitative method for locating your app’s breaking point and measuring how gracefully it recovers.
What Is Mobile App Stress Testing?
Stress testing is the practice of deliberately pushing an application beyond its expected operating limits to observe how it behaves at, and past, the edge of failure. Where most Mobile App Performance Testing validates that a system works under anticipated conditions, stress testing does the opposite: it hunts for the point where the system stops working, then studies what happens next.
For mobile specifically, that “system” is really two systems working together. There’s the backend, the servers, databases, and APIs your app depends on, and there’s the device itself, with its finite RAM, variable CPU, battery constraints, and unpredictable network. A thorough mobile stress test has to probe both. An app can pass every server-side load test and still crash on a mid-range Android handset because it leaks memory during a long, heavy sync.
The real goal: graceful degradation, not survival
The point of a stress test isn’t to prove your app never breaks. Everything breaks eventually. The point is to determine how it breaks. There are two possible outcomes when a system is pushed past its capacity:
- Hard crash. The app or server becomes unresponsive, in-flight data is corrupted or lost, and recovery requires manual intervention, a restart, a rollback, an on-call engineer at 2 a.m.
- Graceful degradation. The system recognizes it’s under strain, sheds non-essential work, throttles or queues requests, and keeps a slower-but-functional experience alive for users until the pressure lets up.
Graceful degradation is the only acceptable outcome for a production system. Finding your breaking point in a test environment is what lets your team build the fail-safes, circuit breakers, load shedding, autoscaling triggers, fallback UI states, that turn a would-be hard crash into a survivable slowdown.
Stress Testing vs. Load Testing: A Crucial Distinction
These two terms get used interchangeably, but they answer different questions, and conflating them leads to a false sense of security.
| Load Testing | Stress Testing | |
| Question it answers | “Can we handle the traffic we expect?” | “At what point do we fail, and what happens then?” |
| Load level | A predefined, realistic target (e.g., 1,000 concurrent users) | Continuously increasing until degradation or failure |
| Primary output | Pass/fail against a performance target | The breaking point and the recovery profile |
| Mindset | Validation | Search-and-destroy |
Load testing confirms your app performs acceptably at a known, expected volume. Stress testing keeps turning up the dial past that volume specifically to find where things fall apart. You need both, but only stress testing tells you your actual ceiling and your safety margin above normal traffic.
What “Breaking Point” Actually Means
The breaking point is the level of demand at which your application’s performance degrades unacceptably or it stops responding altogether. In practical terms, it’s usually expressed as a number of concurrent users or a request throughput, the threshold beyond which response times spike, error rates climb, or the system falls over.
Finding it matters for several concrete reasons:
- You learn how the system handles failure and recovery. Does it self-heal when load subsides, or does it need a manual reboot?
- You get a data-driven answer to capacity planning. You’ll know whether you need more hardware, more instances, or architectural changes, and you’ll avoid over-provisioning expensive infrastructure you don’t actually need.
- You observe the real resource story under strain. Watching CPU, memory, disk I/O, and other server metrics as load ramps up shows you which resource gives out first, which is where optimization pays off.
Importantly, “the breaking point” isn’t a single universal definition, it depends on your requirements. If any error rate above zero is unacceptable for your app, the breaking point is the first moment errors appear. If response time is what matters, the breaking point is when latency crosses a threshold you’ve defined in advance. You decide the failure criteria before the test, then read the results against it.
Why Mobile Apps Break Under Pressure
Applications rarely fail because of one bad line of code. They fail because of the cascading effect of many subsystems interacting under strain. On mobile, those subsystems span the server and the device.
Backend bottlenecks
Database connection pooling. As requests surge, the app layer demands more connections from the database. Too small a pool and requests queue up behind each other; too large and the database CPU pegs at 100% and locks. Stress testing reveals the connection-count sweet spot.
Memory leaks under sustained load. Some bugs only surface after the system has run hot for hours. Monitoring RAM over an extended high-activity window, often called soak testing, a close cousin of stress testing, exposes leaks that a short burst test would miss entirely.
Third-party API latency. Your code may be flawless, but your app leans on external services: payment gateways, identity providers, analytics, ad networks. When one of those becomes the bottleneck under load, your app inherits the problem. Stress testing shows how your app behaves when a dependency slows down or times out.
Microservices gridlock. In modern architectures, a single user tap can fan out into dozens of internal service calls. If one service lags, backpressure can propagate and drag down the whole ecosystem. Stress testing surfaces these chain reactions before they reach production.
On-device resilience: the mobile-only bottlenecks
This is where mobile stress testing diverges sharply from web. The device itself introduces failure modes that don’t exist on a server:
- Low-power state. How does the app handle a heavy task when the battery is at 5% and the OS is aggressively throttling background activity?
- Background process pressure. What happens when the app is pushed to the background mid-way through a large data sync? Does it pause cleanly, or corrupt state?
- Thermal throttling. Does sustained high resource usage heat the device to the point where the CPU throttles itself, cratering performance right when the user needs it most?
- Constrained and flaky networks. A test that passes on office Wi-Fi may fail on a real 3G connection with packet loss. Network conditions are a first-class stress dimension on mobile.
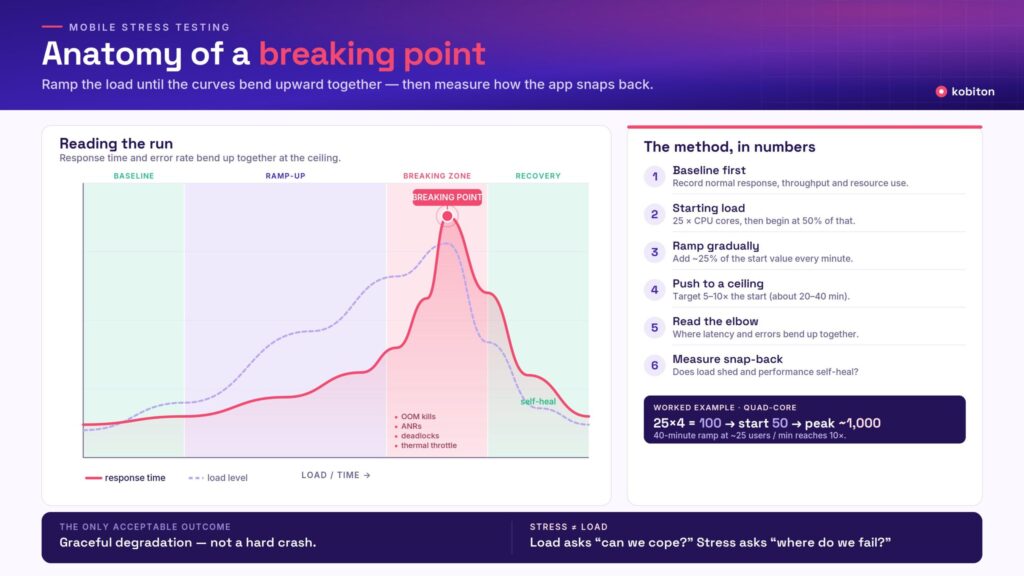
How to Find the Breaking Point: A Step-by-Step Method
Finding a breaking point isn’t random hammering. It’s a disciplined, quantitative process. The steps below combine a strategic lifecycle with a concrete, arithmetic starting point you can apply today.
Step 1: Establish a performance baseline first
Before you try to break anything, you need to know what “normal” looks like. Run tests that mirror your typical, everyday traffic and record baseline response times, throughput, and resource usage. Counterintuitively, finding the breaking point should not be the first thing you do, baseline runs under normal conditions often surface easy wins you can fix before you ever push to the extreme. You can’t recognize degradation without a healthy reference point to compare against.
Step 2: Calculate a sensible starting load
Don’t guess your starting number, and don’t start at the ceiling. If you begin with too much load and the app throws errors immediately, you’ve learned nothing about where the real threshold is.
If you have analytics (a tool like Google Analytics is ideal), use real traffic data to model a realistic concurrent-user count. If you’re testing something new with no historical data, a hardware-based rule of thumb gives you a defensible starting point:
Starting point = 25 × (number of CPU cores)
Recommended start value = Starting point × 50%
For example, an app served by a quad-core web server:
Starting point = 25 × 4 = 100 concurrent users
Recommended start value = 100 × 50% = 50 concurrent users
Beginning at roughly half the calculated starting point gives you headroom to observe the ramp cleanly rather than jumping straight into distress.
Step 3: Design the ramp-up curve
The load has to increase gradually so you can pinpoint exactly where degradation begins. A steady, stepped increase is far more informative than a sudden spike. A practical ramp-up rate is to raise the load by about 25% of the starting-point value at each step, per minute. In the quad-core example above, that’s roughly 25 additional virtual users per minute.
Avoid load curve types that lock you into a predefined user count or throughput target; those are for validation, not discovery. For breaking-point work you want a stepped or dynamically adjustable curve that keeps climbing until the app shows strain.
Step 4: Set the test duration to reach a real ceiling
Duration is driven by how far past the starting point you want to push. A common target is to raise the load to 5–10× the starting point, depending on your performance requirements:
- To reach 5× the starting load, run the ramp for about 20 minutes.
- To reach 10×, run it for about 40 minutes.
Continuing the example: a 40-minute ramp at 25 users/minute drives toward roughly 1,000 concurrent virtual users, a full 10× the starting point, which is usually deep enough to find the edge.
Step 5: Push into the breaking zone
As you climb past capacity, you’re watching for the failure signatures that mark the breaking point:
- Buffer overflows, where incoming data exceeds allocated storage.
- Deadlocks, where two processes each wait on the other and the system freezes.
- Race conditions, where the timing of concurrent events produces logic errors, a class of bug that also has real security implications, since attackers exploit exactly these conditions.
On the device side, this is also where you’ll see out-of-memory kills, thermal throttling, and ANRs (Application Not Responding) surface.
Step 6: Measure recovery, the “snap-back”
Breaking the system is only half the test. Once you’ve found the ceiling, reduce the load and watch what happens. A resilient app self-heals: instances spin back down, queues drain, and performance returns to baseline without anyone touching it. If it doesn’t recover on its own, you’ve found a critical gap, and better to find it here than in production.
Reading the Results: Turning Charts Into a Breaking Point
A good load-testing report gives you time-series charts of load level, response time, and error rate over the run, plus session logs and device details. The breaking point lives in the region where response times climb sharply and error counts rise together, often visually obvious as the moment the curves bend upward.
Where exactly you place the “breaking point” marker within that region depends on the failure criteria you set in Step 1:
- If zero errors is your standard, the breaking point is the first timestamp where errors appear (or where the server stops responding).
- If response time is your standard, the breaking point is where latency first crosses your predefined threshold, even if no hard errors have occurred yet.
Either way, you translate a wall of graphs into a single, actionable number: the demand level your current architecture can sustain, and by extension the safety margin between that ceiling and your normal traffic.
Best Practices for Mobile Stress Testing
The mechanics above only produce trustworthy results if the test itself reflects reality. Four practices make the difference between a number you can act on and one that misleads you.
Script realistic user journeys. Your test scenarios should mirror how real people actually move through your app, browsing, searching, adding to cart, checking out, not just hammering a single endpoint. Real users are also unpredictable, so build in some randomness and variation rather than perfectly uniform robotic behavior. A stress test that doesn’t resemble real usage tells you how your app handles a situation it will never encounter.
Test from multiple geographic regions. Your users connect from everywhere, and geography changes the picture: latency, CDN behavior, and regional infrastructure all shift the results. Generate load from the regions where your users actually live, and if you serve a global audience, distribute the load across regions simultaneously.
Match real devices and network conditions. This is the heart of mobile-specific stress testing. Emulators can approximate behavior, but they can’t reproduce the thermal throttling, memory constraints, and hardware quirks of a real handset under strain. Test across the actual browsers, OS versions, device models, and network types (2G/3G/4G/5G, plus lossy and constrained connections) that represent your user base. Fine-tuning tests to real device and network conditions is what surfaces the failures your users would otherwise hit first.
Baseline before you break. As covered above, normal-traffic runs come before extreme runs. They protect you from chasing phantom problems and often reveal cheap optimizations up front.
Automation, AI, and Chaos Engineering
Modern stress testing has moved well beyond static, hand-written scripts.
Distributed load generation uses cloud-based injectors across multiple regions to simulate global-scale demand without the testing infrastructure itself becoming the bottleneck, a genuine risk when you try to generate hundreds of thousands of virtual users from a single machine.
Chaos engineering, popularized by large-scale operators like Netflix, is stress testing’s most advanced form: deliberately and randomly disabling services (sometimes even in production) to verify the overall system stays upright. It’s the ultimate validation that your graceful-degradation and recovery mechanisms actually work when a real component vanishes.
AI-assisted analysis increasingly layers on top of both, helping teams simulate more chaotic, realistic traffic and, more valuably, perform faster root-cause analysis, pointing engineers toward the specific subsystem that gave out rather than leaving them to sift through logs by hand. Established open-source tools like JMeter and Locust remain widely used for the load-generation layer itself.
The Business Case: Why Stress Testing Pays for Itself
For decision-makers, the value of stress testing is fundamentally about risk mitigation, and it shows up on the balance sheet in three ways.
Revenue protection. For a commerce app, a short outage during a peak event, a Black Friday sale, a flash promotion, a viral moment, can cost enormous sums in lost transactions. Stress testing is what lets you enter those windows knowing your ceiling sits comfortably above the expected surge.
User retention. Users abandon slow experiences quickly; a widely cited benchmark is that a large share of users leave a site or app that takes more than about three seconds to load. Under stress, ordinary load times can easily triple. Finding and fixing the breaking point protects the experience precisely when the most people are watching.
Infrastructure efficiency. Stress testing doesn’t just prevent under-provisioning, it prevents over-provisioning too. By learning exactly where your app breaks and which resource fails first, you can right-size your infrastructure and autoscaling policies instead of paying for idle capacity as an insurance policy.
A quick real-world sketch
Consider an app team that planned for 50,000 users at launch and got 500,000. Because they’d stress-tested rigorously, the system responded as designed: autoscaling spun up additional instances, non-essential features (like high-resolution avatars) were shed to conserve bandwidth, and the database leaned on read-replicas to absorb the query surge. The result was zero downtime during a moment that would have flattened an untested system. That composure under a 10× surprise is exactly what a breaking-point exercise buys you.
Where Kobiton Fits In
The single hardest part of mobile stress testing is the “match real devices and network conditions” best practice, because it requires access to a broad, realistic fleet of physical devices under genuinely stressful conditions, not just emulated approximations.
Kobiton’s real-device cloud is built for exactly this gap. Running your stress and performance scenarios against real iOS and Android hardware lets you observe the on-device failure modes that emulators simply can’t reproduce: memory pressure and out-of-memory kills, thermal throttling under sustained load, battery-state behavior, and performance across the specific device models and OS versions your users actually carry. Because Kobiton supports both scripted automation (including Appium-based frameworks) and manual exploratory sessions, teams can drive repeatable, ramping load scenarios and investigate the ugly edge cases a chart flags, all on the same devices, with the session detail needed to trace a failure back to its cause.
In other words, the methodology in this guide gives you the what and the how much; a real-device cloud gives you a trustworthy where, the actual hardware your breaking point will occur on.
Frequently Asked Questions
What’s the difference between load testing and stress testing?
Load testing checks whether the system handles an expected, predefined number of users acceptably. Stress testing keeps increasing the load past that point specifically to find where the system fails, and to observe how it recovers afterward.
Can stress testing damage my production system?
It can, if done carelessly against live infrastructure. Run stress tests against a staging environment that mirrors production, or during a maintenance window with full backups in place. Never point an uncontrolled breaking-point test at a live database without safeguards.
How often should we stress test?
At minimum, before any major release, marketing push, or seasonal peak. In a CI/CD workflow, lighter automated stress checks can run on a regular cadence so regressions surface early rather than at launch.
Does stress testing overlap with security testing?
Yes. High load frequently exposes race conditions and buffer overflows, the same categories of flaw that attackers exploit. Breaking-point testing is often where latent security vulnerabilities first become visible.
What tools are commonly used?
Open-source tools like JMeter and Locust are longstanding choices for generating load. Cloud-based platforms add distributed, multi-region injection and richer reporting, and for the mobile-device layer specifically, a real-device cloud like Kobiton covers the on-device conditions that server-side tools can’t.
Conclusion
Stress testing isn’t about expecting the best; it’s about preparing for the worst, on purpose, on your own terms. The alternative is discovering your breaking point during a launch, a sale, or a viral spike, in front of the largest audience your app will ever have.
The method is repeatable and quantitative: baseline what normal looks like, calculate a sensible starting load, ramp up gradually to a real ceiling, read the point where response times and errors bend upward together, and then verify the app heals when the pressure lifts. Mobile App Stress Testing helps teams apply this approach to mobile environments by evaluating how applications perform under extreme usage conditions. Do that against realistic user journeys, across real regions, and, critically for mobile, on real devices under genuine strain, and you’ll walk into your next high-traffic moment knowing your limit, your safety margin, and your recovery behavior.
Find your breaking point in the lab. It’s the one place where breaking is a win.
