Mobile App Performance Testing Across Different Devices and Networks: The Complete Guide
In a mobile-first world, your app’s performance is your brand’s first impression. Your backend may respond in milliseconds and your APIs may be flawless, but none of that matters to the user staring at a frozen login screen on a crowded 4G network. To that person, the app is simply slow, and slow apps get uninstalled.
The stakes are measurable. Even a one-second delay in mobile load time can cut conversion rates by as much as 20%. Multiply that across thousands of device models, a dozen active OS versions, and wildly inconsistent carrier networks, and you have the central challenge of modern mobile quality: delivering a fast, stable experience to every user, on any device, over any connection.
This guide breaks down mobile app performance testing across different devices and networks from the metrics that matter and the types of tests you should run, to the tools, monitoring strategies, and CI/CD practices that keep quality high release after release.
Test Performance Across Devices & Networks
Compare iOS vs Android, explore the fragmentation matrix, and see how CI/CD pipelines automate it all
iOS vs Android Performance Lab
Pick a network condition, then watch the same app perform on both platforms in parallel.
Device × Network Coverage Matrix
A snapshot of performance scores across the device-network combinations users actually have. Tap any cell for details.
CI/CD Performance Pipeline
See how automated performance testing fits into your release workflow.
What Is Mobile App Performance Testing Across Devices and Networks?
Mobile app performance testing evaluates how an application behaves under real-world conditions—across different hardware configurations, screen sizes, operating systems, and network environments such as 3G, 4G, 5G, and Wi-Fi. It measures how the app responds when bandwidth drops, latency spikes, packets are lost, or the connection disappears entirely.
The goal is simple to state and hard to achieve: consistent responsiveness, stability, and reliability no matter where or how the app is used. Because users open apps from subways, elevators, rural highways, and packed stadiums, testing only on a fast office Wi-Fi connection with the latest flagship phone gives a dangerously incomplete picture.
Why Performance Testing Matters
Performance is not a "nice to have." It directly drives the business outcomes that determine whether an app succeeds or quietly disappears from users' home screens.
User experience. Sluggish screens, frequent crashes, and unresponsive taps push users toward competitors. Performance testing surfaces these issues before users do, protecting the smooth experience that keeps people coming back.
Revenue. Slow-loading pages and errors interrupt purchases, sign-ups, and subscriptions. Every abandoned checkout is lost revenue, and performance problems are a leading cause of abandonment.
Brand reputation. A poorly performing app invites one-star reviews and negative word of mouth. Reliability is a core part of how users judge a brand's credibility.
App store ranking and discoverability. Ratings, reviews, download velocity, and stability all feed into store rankings. Poor performance drags all of them down, reducing visibility in a crowded marketplace.
Competitive edge. In a saturated market, a consistently fast and stable experience is a genuine differentiator. Catching bottlenecks early in development also saves significant time and cost later.
The Core Challenge: Fragmentation
Unlike a web app that runs in a handful of standardized browsers, a mobile app must survive a fragmented ecosystem. The complexity comes from three overlapping sources.
Device and OS fragmentation
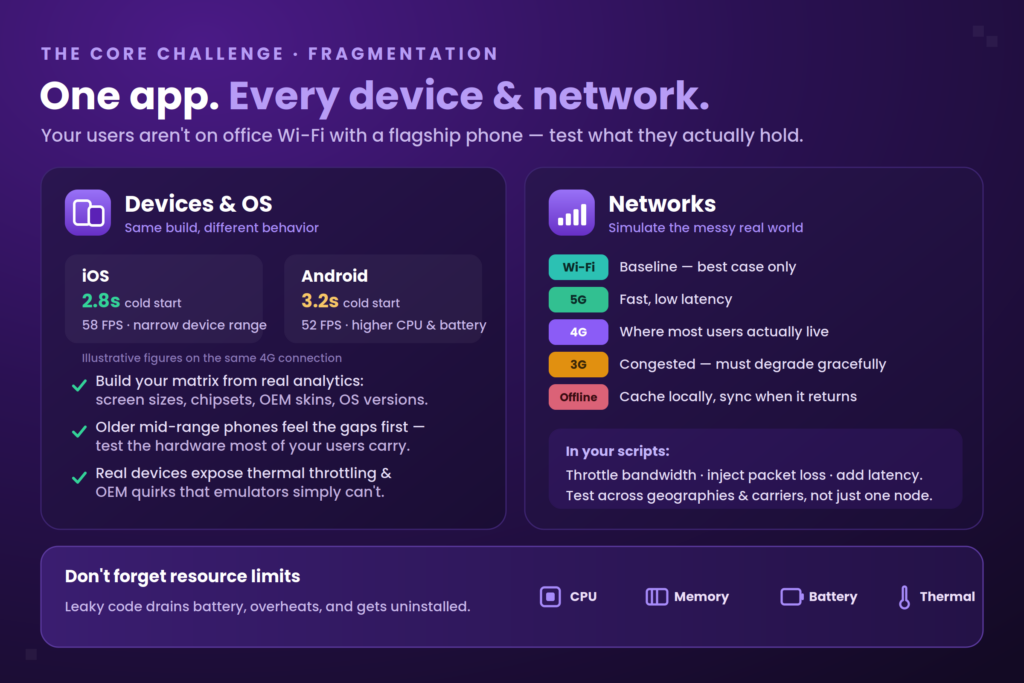
Android alone spans thousands of device models with different chipsets, screen sizes, resolutions, and manufacturer (OEM) skins—each of which can introduce surprising behavioral differences. iOS covers far fewer devices, but still demands precise optimization for specific hardware generations. An app that feels instant on this year's flagship may stutter on a three-year-old mid-range handset that a large share of your users still carry.
Network variability
Bandwidth, latency, and packet loss fluctuate constantly in the real world. A screen that loads in half a second on Wi-Fi may take five seconds on congested 3G. Apps have to degrade gracefully rather than freeze or crash when the connection weakens.
Resource constraints
Phones have finite CPU, memory, storage, and—critically—battery. Code that leaks memory or hammers the CPU will cause slowdowns, overheating, and rapid battery drain, all of which are top reasons for uninstalls.
Testing Across Different Devices: iOS vs. Android
Managing platform differences is one of the hardest parts of mobile performance testing. The same build can behave very differently on iOS and Android because of divergent hardware, memory management, and OS-level rules.
Where the platforms differ
- Android must support an enormous matrix of devices and OS versions, and its broader memory-management overhead can show up as slightly slower launches and lower frame rates on comparable hardware. Background execution limits and Doze mode can also change how an app behaves when idle.
- iOS runs on a narrower device range, which simplifies coverage, but its automation environment (XCUITest) is more sandboxed, and each hardware generation still needs targeted optimization.
- Element identification differs too: iOS relies on Accessibility IDs while Android uses Resource IDs—something your automation framework and tooling must handle cleanly.
A quick illustration of how identical conditions produce different results: on a 4G connection, an iOS device might cold-launch an app in roughly 2.8 seconds at 58 FPS, while the equivalent Android device launches in about 3.2 seconds at 52 FPS with higher CPU and battery draw. Both may be "acceptable," but users on older Android hardware are the ones most likely to feel the gap—exactly the segment worth testing hardest.
Real devices vs. emulators and simulators
Emulators and simulators are fast, cheap, and excellent for early functional and UI checks. But they cannot faithfully reproduce real-world performance factors like thermal throttling, sluggish older processors, biometrics, push notifications, or OEM-specific quirks. For trustworthy performance numbers—CPU, memory, battery, frame rate—you need real devices.
This is where a real-device cloud like Kobiton earns its place: it gives teams on-demand access to a wide range of real iOS and Android devices, so performance is measured under true hardware conditions rather than idealized emulation. The practical strategy most teams adopt is a hybrid one—emulators for broad, inexpensive compatibility sweeps, and real devices for the performance-critical tests that actually predict the user experience.
Building your device matrix
You don't need every device ever made—you need the ones your users actually hold. Use your own analytics to build a representative matrix that covers:
- Screen sizes and resolutions (small phones through tablets) to confirm UI consistency.
- Computing power (newest flagships alongside older, slower models).
- OEM skins and OS versions that dominate your install base.
Testing Across Different Networks
Network conditions deserve the same deliberate coverage as devices, because they shape the experience just as much.
Simulate the full range of connections
Test across Wi-Fi, 5G, 4G, and 3G, and don't stop at the happy path. Advanced tools let you throttle bandwidth, inject packet loss, and add latency to mimic spotty 4G, congested urban cells, or captive-portal Wi-Fi. This reveals how the app feels for users in emerging markets or dense city centers where connections are anything but pristine.
Test offline and flaky connections
Real mobile usage includes dead zones. Your scripts should verify what happens when the network drops and later returns: does the app cache data correctly, allow the actions it should, and sync cleanly once connectivity is restored? For travel, retail, banking, and utility apps, graceful offline behavior is essential rather than optional.
Account for geography and carriers
Performance varies dramatically by location and mobile carrier. Testing from multiple geographic nodes—ideally including last-mile ISP connections and nodes near major carriers—helps you isolate whether a slowdown is coming from your servers or from a specific regional network. Carrier-specific performance data can reveal that users on one network consistently see slower loads or higher failure rates than others.
Key Metrics to Track
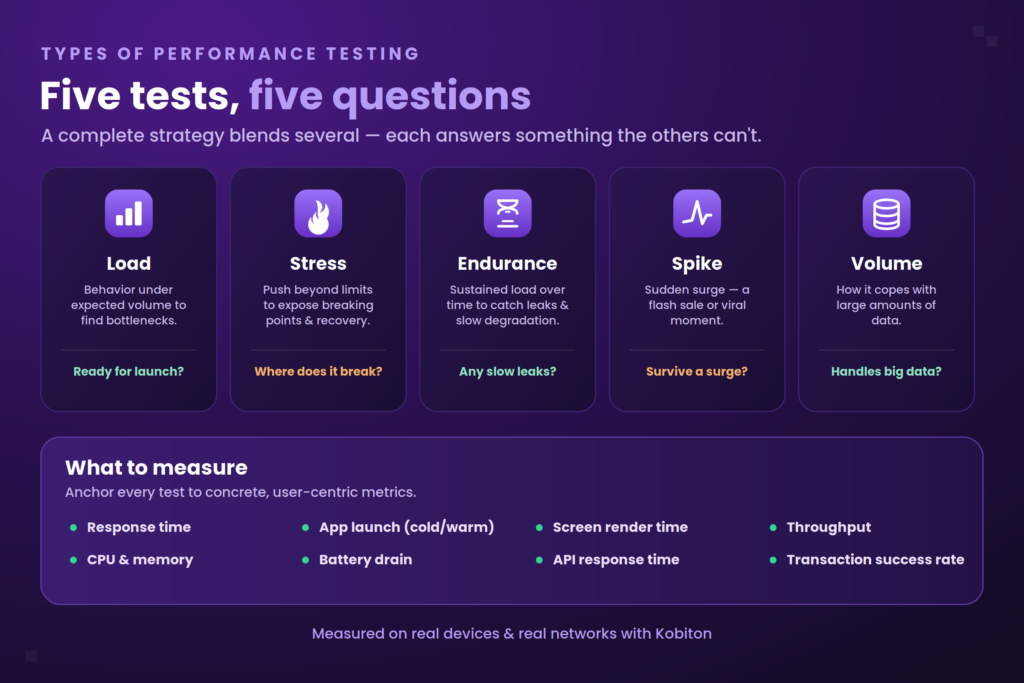
To move past vague talk of "speed," anchor your testing to concrete, user-centric metrics:
- Response time — the delay between a user action and the app's reaction; the single most felt measure of speed.
- App launch time (cold and warm) — how quickly the app becomes usable from a full start versus resuming; this is the user's first impression.
- Screen render time — how long a new screen takes to become fully interactive.
- Throughput — how many transactions or requests the app handles in a given window; vital for high-traffic apps.
- Resource utilization — CPU, memory, and storage consumption; runaway usage causes slowdowns and crashes.
- Battery drain — power consumed during use; excessive drain is a fast track to uninstalls.
- Network performance — download speed, upload speed, and latency across connection types.
- API response times — how backend and third-party calls perform from the mobile client's perspective.
- Transaction success rate — the percentage of critical journeys (login, checkout) that complete successfully.
- Carrier-specific performance — whether particular networks systematically underperform.
Types of Performance Testing
Different questions call for different tests. A complete strategy blends several of the following.
Load testing measures behavior under expected user volumes to find bottlenecks before launch. Stress testing pushes the app beyond normal limits to expose breaking points and check how gracefully it recovers. Endurance (soak) testing runs a sustained load over long periods to catch memory leaks and gradual degradation. Spike testing simulates sudden surges—think a flash sale or viral moment—to gauge responsiveness and recovery. Volume testing evaluates how the app copes with large amounts of data.
Beyond these core performance tests, a well-rounded quality program surrounds them with compatibility testing (does it work across the device/OS matrix?), usability testing (is it easy to use?), localization testing (is it correct across languages and regions?), security testing (does it resist breaches and unauthorized access?), accessibility testing (can people with disabilities use it, per standards like WCAG?), and regression testing (did a recent change break something that used to work?).
Tools and Frameworks
The tooling landscape is broad. Most teams combine several categories rather than relying on one.
Open-source frameworks. Appium is a popular cross-platform automation choice supporting iOS and Android; XCTest is Apple's native iOS framework; Espresso is Android's native UI testing tool; and JUnit and JMeter (though web-oriented) can be adapted for component and backend load testing. Gatling handles high-performance load simulation.
Native profilers. Android Profiler and Xcode Instruments give deep, on-device visibility into CPU, memory, and battery behavior.
Cloud and real-device platforms. Cloud-based device labs let teams run tests on real hardware at scale, across many models and network conditions, without maintaining a physical device lab. Kobiton, along with options like BrowserStack, AWS Device Farm, and Sauce Labs, provides access to real devices so teams can capture accurate, real-world performance data.
Supporting tools. Network simulation utilities reproduce latency and packet loss; memory profilers hunt down leaks; and user-behavior analytics reveal real-world usage patterns that should shape which journeys you test most.
Proactive Quality: Synthetic Monitoring vs. Real User Monitoring
Testing before release is necessary but not sufficient. Once an app is live, two complementary monitoring approaches keep it healthy—and this is where many teams have the biggest coverage gap.
Synthetic monitoring runs automated, scripted user journeys (launch, log in, search, check out) on a schedule from real devices, chosen locations, and defined network profiles. Because it doesn't wait for real traffic, it acts as a 24/7 early-warning system that catches outages and regressions before users are affected. It's ideal for guarding critical "golden path" journeys and validating SLAs.
Real User Monitoring (RUM) captures data from actual live users. It reveals how the app performs in the messy real world and surfaces long-tail issues you'd never think to script—but only where and when real traffic exists.
| Aspect | Synthetic Monitoring | Real User Monitoring (RUM) |
| Data source | Scripted, simulated journeys | Actual live user interactions |
| Primary purpose | Proactive detection, SLA validation | Analyzing real behavior in the wild |
| Coverage | The specific paths you script | Every real interaction, when traffic exists |
| Environment | Devices, locations, and networks you choose | The uncontrolled real world |
The two are not rivals. Synthetic monitoring tells you when a known-critical flow breaks; RUM tells you what real users are actually experiencing across the long tail. Together they give full-spectrum visibility.
A Step-by-Step Testing Process
A repeatable process turns performance testing from an ad-hoc scramble into a reliable discipline:
- Requirement analysis — define performance goals, user expectations, and KPIs, along with clear acceptance criteria.
- Planning and strategy — set objectives, scope, environments, tools, timelines, and benchmarks.
- Designing test cases — cover realistic scenarios across user loads, data volumes, device types, and network conditions.
- Setting up the test environment — configure hardware, software, and network profiles that mirror real-world use, ideally on real devices.
- Executing tests — run the cases, capture metrics, and note deviations.
- Monitoring and analysis — compare results against benchmarks and correlate data to pinpoint bottlenecks.
- Result reporting — summarize findings with clear metrics, charts, and actionable recommendations for stakeholders.
- Optimization and retesting — fix the issues, then retest to confirm the improvements held.
Integrating Performance Testing Into CI/CD
In fast-moving teams, manual testing alone can't keep pace. Embedding performance tests into the CI/CD pipeline enforces "shift-left" quality—catching regressions the moment they're introduced rather than after release.
A strong pipeline:
- Runs automated tests across multiple real devices and OS versions on every build.
- Simulates a range of network conditions to check responsiveness.
- Collects load times, memory usage, frame rates, and battery consumption.
- Generates detailed reports so developers can fix bottlenecks fast.
- Triggers alerts (to Slack, PagerDuty, or a dashboard) when a metric crosses a threshold—for example, an app launch exceeding three seconds.
For live apps, the same critical-journey scripts can also run continuously in production, every few minutes from key regions, providing ongoing assurance and a low Mean Time to Detection (MTTD).
Best Practices
- Test early and often. Building performance testing into the earliest development stages cuts the cost and effort of fixing issues later.
- Simulate real-world conditions. Reproduce the network profiles, device types, and user loads your audience actually experiences—don't rely on ideal lab settings.
- Prioritize real devices for performance-critical tests. Pair them with emulators for broad, low-cost compatibility coverage.
- Automate wherever it pays off. Automation reduces human error and makes frequent, repeatable testing feasible.
- Monitor external factors. Network congestion, battery levels, and OS updates all affect results; tracking them helps isolate whether an issue belongs to the app or the environment.
- Keep monitoring after release. Combine synthetic monitoring and RUM with crash reporting to sustain quality in production.
- Adapt behavior to the network. Defer heavy data operations on slow connections and cache aggressively so the experience degrades gracefully.
Common Challenges and How to Overcome Them
| Challenge | Practical solution |
| Device fragmentation | Test a representative device sample, lean on a real-device cloud, and use responsive design to adapt across screen sizes. |
| Network variability | Test across Wi-Fi/3G/4G/5G, optimize data transfer, and handle network errors gracefully. |
| Resource constraints | Optimize code, minimize resource use, and cache to reduce load times. |
| Battery drain | Favor energy-efficient code, optimize background tasks, and offer battery-saving options. |
| User concurrency | Use server-side load balancing, optimized queries, and caching to hold response times under heavy load. |
| Script maintenance | UI changes break scripts—mitigate with modular design and self-healing locators. |
| Alert noise | Trigger alerts only after failures across multiple locations or checks to reduce false positives. |
The Future: AI and Predictive Analytics
The leading edge of performance testing is shifting from detection to prediction. Machine-learning models trained on historical performance data can forecast when a metric is likely to breach acceptable thresholds based on seasonal or growth trends, automatically correlate a spike in launch time with a specific recent deployment or regional outage, and reduce alert fatigue by learning which anomalies actually precede user-impacting incidents. The result is monitoring that warns you about problems before they fully materialize.
Conclusion
Testing mobile app performance across different devices and networks is no longer optional—it's foundational to a high-quality user experience. The apps that win are the ones that stay fast and stable, whether they're running on a brand-new iPhone over 5G or a three-year-old Android phone on a weak 3G signal.
Getting there means combining the right ingredients: clear metrics, a representative device matrix, realistic network simulation, the full range of performance test types, disciplined CI/CD integration, and proactive monitoring that blends synthetic checks with real user data. Real-device testing platforms like Kobiton make this achievable at scale by putting genuine hardware and real-world conditions within reach of every team.
In a crowded market, performance isn't just a technical checkbox—it's a direct driver of user satisfaction, retention, and long-term growth.
Frequently Asked Questions
Why is mobile app performance testing important?
It ensures an app stays fast, stable, and reliable across the devices, OS versions, and network conditions real users have—preventing the crashes, slow loads, and unresponsiveness that drive uninstalls, poor reviews, and lost revenue.
How does performance differ between iOS and Android?
Differences in hardware, memory management, and OS rules (like Android's Doze mode and background limits, or iOS's more sandboxed automation) mean the same build can behave differently on each platform. That's why cross-platform testing on real devices is essential.
Should I test on real devices or emulators?
Both. Emulators are great for fast, inexpensive functional and compatibility checks, but only real devices accurately capture performance factors like CPU load, battery drain, thermal throttling, and OEM-specific behavior. A hybrid approach gives the best coverage per dollar.
What's the difference between synthetic monitoring and real user monitoring?
Synthetic monitoring runs scripted journeys on a schedule to proactively catch issues in critical flows—even with zero live traffic. RUM captures data from actual users to reveal real-world behavior and long-tail issues. Used together, they provide complete visibility.
How do I add performance testing to a CI/CD pipeline?
Automate tests to run on every build across multiple devices and OS versions, simulate different network conditions, collect metrics like load time and memory usage, generate reports, and set threshold-based alerts so regressions are caught before release.
Which tools are commonly used?
Open-source frameworks like Appium, XCTest, Espresso, and JMeter; native profilers like Android Profiler and Xcode Instruments; and real-device cloud platforms such as Kobiton, BrowserStack, AWS Device Farm, and Sauce Labs.
