From days to hours: the goal of parallel mobile testing on real devices
Mobile regression suites grow fast. Every new feature, OS version, and device form factor widens the coverage gap, and most teams are already stretched. Running tests sequentially across ten or twenty real devices isn’t a bottleneck you can engineer around by adding headcount. It’s a structural problem that only parallel execution solves.
The promise is straightforward: instead of running 400 tests serially on one device over six hours, distribute them across ten devices and finish in under an hour. That’s the wall-clock math. The hard part is delivering on it without introducing flakiness, session collisions, or CI failures that cost more time than the parallelism saves.
This guide covers the complete picture: how to distribute tests correctly, isolate state, configure Appium sessions for real devices, troubleshoot the most common failure modes, and integrate everything into a CI/CD pipeline that stays reliable at scale.
What “parallel” means in mobile QA (and why real devices change the problem)
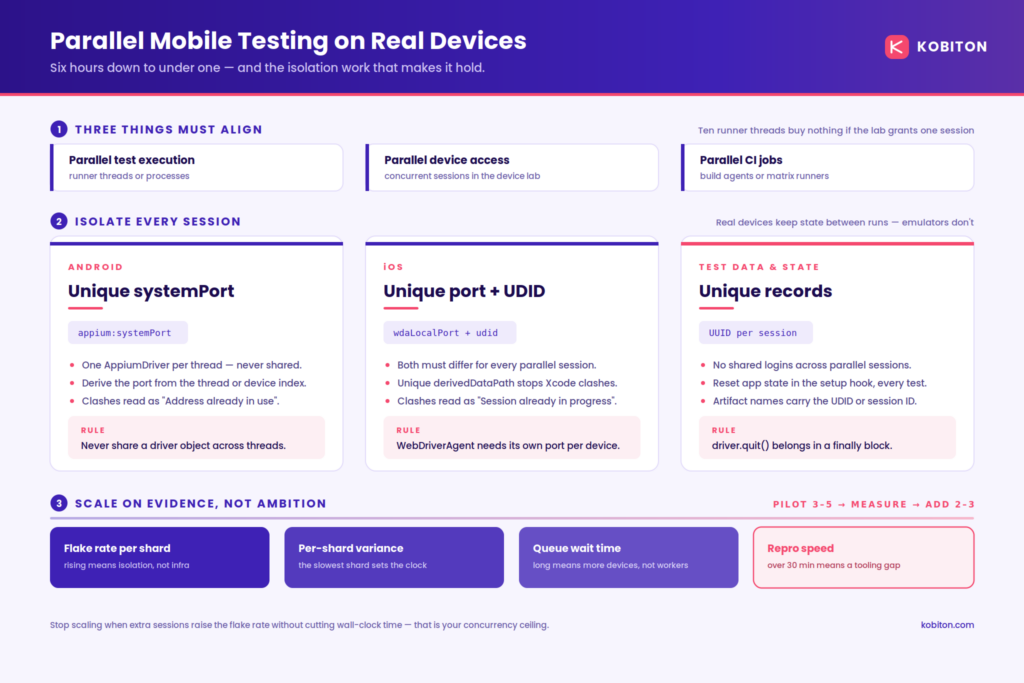
Three distinct things often get conflated under the word “parallel”:
Parallel test execution means multiple tests running at the same time, typically managed by a test runner like TestNG, JUnit, or pytest-xdist. The runner spawns multiple threads or processes and sends test commands to separate driver instances.
Parallel device access means multiple physical or virtual devices accepting sessions simultaneously. This is a function of your device infrastructure, whether that’s an on-prem device lab or a Mobile Device Cloud.
Parallel CI jobs means your CI system (Jenkins, GitHub Actions, etc.) dispatches multiple build agents or workflow runners at once, each responsible for a slice of the test suite.
All three have to align. A test runner that forks ten threads doesn’t help if your device lab only grants one concurrent session. A CI system with ten agents doesn’t help if all ten share the same test data.
Real devices make this harder than emulators in a specific way. Emulators are ephemeral: spin one up, tear it down, the state is gone. A physical device persists state across sessions unless you explicitly clean it. App data, cached credentials, notification permissions, and local storage all survive test runs unless your teardown logic removes them. That persistence is what makes real-device results trustworthy. It’s also what makes shared-state bugs devastating in a parallel context.
The practical takeaway: parallelism on real devices requires session isolation and data isolation, not just additional workers a direct consequence of how real devices differ from emulators.
Execution model: how tests get distributed across devices
Test suite sharding
Sharding is the process of splitting a test suite into N chunks and assigning each chunk to a separate worker (device). Three common strategies:
By count: Divide the total number of tests evenly. Simple to implement but ignores test duration variance. If one shard gets all your slow login flows, it becomes the bottleneck.
By estimated runtime: Split based on historical execution time data so each shard finishes in roughly the same wall-clock window. This requires instrumented test runs that record per-test duration. It’s more work upfront and pays dividends as the suite grows.
By risk or coverage tier: Group tests by business criticality or feature area. Run the highest-risk tier first on the most devices, and let lower-risk smoke tests run in a second wave. This approach pairs well with release-gate strategies where you need a fast signal on the critical path.
Some frameworks expose sharding flags directly, and framework-specific sharding is usually the most reliable option when it is available. What it does not solve is device supply: the shards still need somewhere to run, and a runner that splits a suite ten ways is worth nothing against a lab that grants one concurrent session. On Kobiton’s Mobile Device Cloud, allocation and concurrency are handled at the platform layer, so your runner passes a shard index and a capability profile and never has to track which physical device is free.
Device allocation: static mapping vs. dynamic pools
Static device mapping assigns specific tests to specific device UDIDs in your configuration. The benefit is determinism: you always know which device ran which test. The drawback is fragility. If a device is offline or in use, that shard stalls.
Dynamic device pools let your orchestration layer pick any available device from a pool matching your capability requirements (OS version, form factor, manufacturer). This maximizes utilization and handles device unavailability gracefully. The trade-off is that test-to-device attribution becomes less predictable unless your infrastructure logs it per session.
For most enterprise teams running regression suites on a Mobile Device Cloud, dynamic pools with capability-based selection give better throughput. Reserve static mapping for tests that are explicitly device-specific (hardware feature validation, carrier-specific behavior, etc.).
Workers and capabilities
Every concurrent session needs a unique set of Appium desired capabilities. The rule is one driver instance per thread or worker, and each driver must target a distinct device. Reusing a single driver across threads is the fastest way to produce non-deterministic failures.
The capabilities that must be unique per session are covered in detail in the next section.
Appium parallelism checklist: determinism first
Getting Appium parallel execution right on real devices requires attention at three levels: driver management, session-level configuration, and test data hygiene.
Driver management
- One AppiumDriver instance per thread. Never share a driver object across test threads.
- Use a thread-local variable or dependency injection to scope driver instances to their executing thread.
- Initialize the driver in a @BeforeMethod (TestNG) or equivalent setup hook, and call driver.quit() in @AfterMethod. Every session must be cleanly terminated, not just abandoned.
- If your framework supports parallel factories, configure dataProvider or parameterized test methods to supply distinct capability sets per execution branch.
Android session isolation
Each Android session running in parallel needs a unique systemPort. This is the port Appium uses to communicate with UIAutomator2 on the device. If two sessions share a systemPort, one will fail with a connection error that’s hard to diagnose unless you know where to look.
Set appium:systemPort to a distinct value per session. A common pattern is to derive the port from the device index or thread ID at runtime so the assignment is automatic.
Two further ports must be unique per session, depending on what the suite touches. Set appium:chromedriverPort to a distinct value whenever tests hit web views or Chrome, because Appium runs a separate Chromedriver instance per session. Set appium:mjpegServerPort to a distinct value whenever the session records video. Both produce failures that look identical to a systemPort conflict, which is why teams often fix the first port, see the same error return, and wrongly conclude that parallelism on real devices is inherently unstable.
iOS session isolation
iOS parallel execution via WebDriverAgent requires up to four unique per-session values, per the official Appium XCUITest driver documentation:
- appium:udid — a unique device UDID for each parallel session.
- appium:wdaLocalPort — a unique port number for each session. The default is 8100, so deriving the port as 8100 + worker index is the conventional pattern.
- appium:derivedDataPath — a unique derived data path root per driver instance. This prevents Xcode build artifacts from colliding and measurably speeds up parallel session startup. Treat it as required, not optional.
- appium:mjpegServerPort — a unique port number for each session if you record a video stream from it. The default is 9100.
Without a unique wdaLocalPort, the WebDriverAgent instance on one device competes with the runner on another, and commands can land on the wrong device entirely. Without a unique mjpegServerPort, video capture silently records another session’s screen a failure that looks like an app bug until you watch the recording.
Test data and state isolation checklist
- Each test uses a dedicated test account or generates unique user data at runtime (no shared login credentials across parallel sessions).
- Backend records created during a test are scoped to that test’s session and cleaned up in teardown.
- App state is reset before each test: clear app data, logout, or reinstall as appropriate for your coverage tier.
- File system artifacts (screenshots, downloaded files, exports) are written to paths that include a session ID or device UDID to prevent overwrites.
- External dependencies (APIs, databases, payment sandboxes) either support concurrent access without state leakage or are mocked per session.
Common failure modes when running many real devices at once
Parallel test failures at scale tend to cluster into two categories: flakiness from shared state and infrastructure collisions from misconfigured sessions. Both are solvable, but they require different fixes.
Flakiness drivers
Race conditions in test setup: Two parallel tests attempting to create the same backend resource simultaneously. One wins, one fails with a conflict error that looks like an app bug. Fix: use unique identifiers (UUID-based usernames, isolated test tenants) so concurrent setup operations never touch the same records.
Hardcoded timeouts and waits: A Thread.sleep(3000) that works on an idle device becomes a source of intermittent failure when the device is under load from a parallel session or when network latency spikes. Fix: replace all fixed waits with explicit waits that poll for a condition.
Shared state from previous sessions: If teardown is incomplete (say, driver.quit() was skipped after a failure), app state from one run contaminates the next. Fix: always run teardown in a finally block or equivalent, and add a setup step that validates clean state before the test body executes.
External service variability: A third-party API that responds in 200ms under normal load can spike to 2,000ms when ten sessions hit it simultaneously. Fix: either mock the dependency or configure dynamic waits with realistic ceiling values.
Infrastructure collisions
| Symptom | Likely cause | Fix |
| “Could not connect to WebDriverAgent”, or commands landing on the wrong iOS device | wdaLocalPort collision across sessions | Assign a unique appium:wdaLocalPort and appium:derivedDataPath per session |
| “Session already in progress” from the Appium server | A previous session was never terminated — driver.quit() skipped after a failure | Run teardown in a finally block; do not enable –session-override on a server handling parallel sessions |
| Video capture fails or returns another device’s stream | Duplicate mjpegServerPort across sessions | Assign a unique appium:mjpegServerPort per session |
The “is it my app or your rig?” problem
This is one of the most expensive debugging scenarios in parallel mobile QA. A test fails. You don’t know if the failure is a genuine app regression, a device-specific hardware/OS quirk, or an infrastructure problem (network, session config, port conflict). Without session-level visibility, you spend hours trying to reproduce the failure manually.
As covered earlier, Session Explorer answers the “app bug or infrastructure?” question from evidence rather than from re-running the test manually. It also supports a second use case worth building into your process deliberately: validating that a fix actually worked. After resolving a defect, compare the before and after session timelines to confirm the behaviour changed in the way you expected, rather than inferring it from a green test that may be green for an unrelated reason.
Device scaling strategy: choosing the right parallel count
More parallel sessions don’t automatically mean faster results. They can increase flakiness, exhaust device pools, and raise costs without improving throughput if the underlying test isolation isn’t solid.
Start with a pilot
Before scaling to maximum concurrency, run a pilot with three to five parallel sessions on your most stable test suite. Measure:
- Wall-clock duration per shard
- Flake rate (tests that fail in parallel but pass when run in isolation)
- Queue wait time (how long sessions wait before a device is assigned)
- Per-shard runtime variance (are shards finishing at roughly the same time?)
If flake rate increases significantly in parallel vs. serial, that’s a signal to fix isolation before adding more sessions. If queue wait time dominates, you need more devices, not a faster runner.
Right-sizing workers to device capacity
A useful heuristic: set your maximum parallel session count to the number of devices you can reliably provision, minus a buffer for retries. If your device lab has 20 devices, capping at 18 parallel sessions gives most tests near-immediate device access while keeping two slots free. Size that buffer against your session duration rather than guessing at it at eight minutes per session, two spare devices absorb roughly fifteen retries an hour, which is comfortable for a suite with a low flake rate and far too thin for one still being stabilised.
Avoid treating average test duration as your planning metric. Plan for the tail. If most tests finish in four minutes but ten percent take twelve, any shard that happens to receive several of those outliers overruns the rest by a wide margin and the pipeline finishes when the slowest shard finishes, not when the average one does. Either isolate the slow tests into a dedicated shard so the outliers stop distorting everything around them, or investigate why they are outliers in the first place.
Trade-offs to account for
Running more parallel sessions increases the probability that shared-state bugs surface. That’s actually useful feedback during initial parallel rollout: it reveals isolation problems that already existed but weren’t visible in serial runs. Treat early parallel failures as a test-quality signal, not just an infrastructure problem.
Cost scales with device usage. If you’re using a cloud device lab, understand how concurrency maps to your plan’s session limits before scaling aggressively.
CI/CD integration: run parallel mobile tests automatically
The orchestration pattern for parallel mobile testing in CI follows a consistent structure regardless of whether you use Jenkins, GitHub Actions, or another system:
Build app -> Upload to device lab -> Split/shard tests -> Dispatch N parallel jobs -> Collect artifacts -> Report results
Jenkins approach
In Jenkins, parallel stages inside a Jenkinsfile pipeline let you run multiple test agents simultaneously. Each stage receives a distinct shard index and the corresponding device capability set. The key configuration decisions are:
- Set each agent to a dedicated executor with its own workspace so file system artifacts don’t collide.
- Pass shard index and device UDID as environment variables into the test runner.
- Use post { always { … } } blocks to collect test reports and artifacts from each agent regardless of pass/fail status.
- Implement a timeout() step at the stage level to prevent a hung device session from blocking the entire pipeline.
Fast-fail is important at the environment validation step (before tests run): if the app build isn’t available, if device credentials are missing, or if the Appium server is unreachable, fail immediately rather than letting workers spin waiting for a condition that won’t resolve.
Kobiton’s Jenkins plugin removes most of the glue code described above: it uploads the app build to the Kobiton Apps Repository and dispatches Appium tests against the device pool from within the pipeline, so each parallel stage requests a device profile instead of tracking UDIDs by hand. The same pattern applies to GitHub Actions and the rest of the toolchain through Kobiton’s integrations, which means the orchestration work reduces to passing a shard index the device layer is already handled.
GitHub Actions approach
GitHub Actions supports parallel jobs via matrix strategies. Define a matrix of shard indices and let the runner instantiate one job per shard. Each job:
- Checks out the repository and restores dependency caches.
- Sets device capabilities and shard parameters as job-level environment variables.
- Executes the test runner with the shard-specific configuration.
- Uploads test results and artifacts using actions/upload-artifact, with the artifact name including the shard index and device identifier.
Collecting results from matrix jobs requires a separate aggregation step that downloads all artifacts and merges test reports. This step should run even if individual shard jobs fail.
Artifact naming
Every artifact produced by a parallel run (screenshots, video recordings, Appium server logs, test result XML) must include a unique identifier in the file name. Device UDID, shard index, and session ID are all reliable options. Without unique naming, parallel jobs writing to a shared storage location overwrite each other’s outputs, and you lose the per-session evidence needed for debugging.
What to measure so parallelization stays trustworthy
Speed is the obvious metric. It’s not the only one that matters.
Metrics to track
Flake rate per shard: What percentage of test runs produce a different result on a retry without a code change? A rising flake rate after adding parallel sessions is the clearest signal of an isolation problem.
Pass/fail reproducibility: Run the same shard twice in sequence without any code change. The result should be identical. If it isn’t, something in the test or environment is non-deterministic.
Per-shard runtime distribution: Are shards finishing at roughly the same time? A wide distribution suggests uneven test distribution. The slowest shard sets your total pipeline duration.
Defect reproduction speed: When a parallel run surfaces a failure, how quickly can an engineer reproduce it? If reproduction takes more than 30 minutes, your session debugging tooling needs improvement.
Queue wait time: How long does a session wait before a device is assigned? Long queue times indicate device pool exhaustion and point to a need for more devices, not more workers.
Session-level attribution
The most expensive debugging scenario in parallel mobile QA is a failure that can’t be reliably reproduced. An engineer runs the test again manually, it passes. The parallel run logs show a failure, but the error message is ambiguous. Without a session replay, the investigation stalls.
Kobiton’s Session Explorer gives engineers a complete record of what happened during each test session: the Appium commands sent, device responses, screenshots captured at each step, device logs, and hardware performance metrics (CPU, memory, battery, network). When a parallel run surfaces a failure, Session Explorer lets you open that specific session and walk through it step by step. The question “is it my app or the infrastructure?” gets answered from evidence, not guesswork.
This session-level granularity also supports a second use case: validating that a fix worked. After resolving a defect, you can compare the before and after session timelines to confirm the behavior changed as expected.
Where Kobiton fits: real-device labs and session-level debugging for parallel runs
Parallel mobile test execution requires two things from your infrastructure: reliable concurrent device access and session-level observability when something goes wrong.
Kobiton’s Mobile Device Cloud and Device Lab Management capabilities provide the device infrastructure layer: real Android and iOS devices available for parallel sessions, with capability-based device selection so your test runner can request the right device profile without managing physical inventory.
For teams building automation from scratch or scaling an existing Appium suite, Kobiton’s Appium Script Generation converts recorded manual test sessions into reusable Appium scripts. This reduces the authoring bottleneck that often limits how many tests a team can realistically parallelize.
Xium, Kobiton’s Appium-based automation technology enhanced with AI/ML, runs up to 2-3x faster than standard Appium. In a parallel context that compounds rather than adds: per-session duration is the multiplier on every shard at once, so a session engine that is twice as fast cuts total pipeline time across all ten or twenty devices simultaneously, without adding a single device to the pool or changing a line of test code.
Session Explorer ties it together on the debugging side. Every parallel session produces a complete artifact trail: commands, screenshots, device logs, and performance metrics. When a shard fails, the investigation starts from evidence, not from trying to reproduce a race condition manually.
Implementation blueprint: a phased rollout plan
Phase 1: audit for test independence
Before adding any parallelism infrastructure, audit your existing test suite for shared state. Run two copies of the same test simultaneously in your local environment and check whether they conflict. Common failure points are shared login credentials, hardcoded port numbers, and backend records created with static identifiers.
Fix isolation issues at this stage. Parallelism will amplify any shared-state problem that exists in your serial suite.
Phase 2: add sharding and session isolation
Choose your sharding strategy (by count is fine for a first pass) and configure unique Appium capabilities per session:
- Android: assign a unique appium:systemPort per worker.
- iOS: assign a unique wdaLocalPort and unique udid per worker.
- All platforms: include device UDID or session ID in artifact file names.
Add test data reset to your setup hooks so each test starts from a known clean state.
Phase 3: run a parallel pilot in CI
Configure two or three parallel shards in your CI system using the orchestration pattern described above (build, shard, dispatch, collect). Run your most stable test suite in this configuration for several builds. Measure flake rate and shard duration variance before expanding.
If flake rate is acceptable (under 2% is a reasonable target for a starting threshold), proceed to Phase 4.
Phase 4: scale gradually
Add parallel sessions incrementally, two or three at a time. Observe queue wait time and flake rate at each increment. Stop scaling when adding more sessions increases flake rate without meaningfully reducing wall-clock duration. That’s your practical concurrency ceiling given your current device pool and test isolation quality.
Pre-launch checklist
- Unique appium:systemPort assigned per Android session
- Unique wdaLocalPort and udid assigned per iOS session
- Test data setup creates unique records per session (no shared credentials)
- App state reset verified in @BeforeMethod or equivalent
- Artifact file names include device UDID or session ID
- driver.quit() called in finally block (teardown never skipped)
- CI pipeline collects artifacts from all shards regardless of pass/fail
- Timeout set at the stage/job level to prevent indefinitely hung sessions
- Retry policy configured (1 retry on infrastructure-category failures, not logic failures)
- Flake rate baseline measured from serial run before comparing to parallel
Why emulator parallelism isn’t the same problem
Most documentation on Appium parallel execution focuses on simulators and emulators. The mechanics are similar, but the stakes and the failure modes differ in ways that matter for release-blocking suites.
Emulators are controlled software environments. You can spin up ten identical emulator instances on a single CI machine, each with a clean OS snapshot, and they behave consistently. Port conflicts are still a concern, but state persistence is not: each emulator instance starts fresh.
Real devices carry persistent state, hardware variation, OS-level background processes, and real network conditions. A test that passes on an emulator can fail on a physical device because the Bluetooth stack is active, a background app is consuming CPU, or a carrier-specific configuration changes network timing. These are the failures that matter for production quality.
For release-blocking regression suites, testing only on emulators leaves a category of real-world failures undetected. Parallel execution on real devices isn’t just a speed optimization. It’s how enterprise teams achieve coverage at release velocity without trading reliability.
The figures below are planning heuristics drawn from common enterprise rollout patterns, not benchmarks. Use them as starting points and calibrate against your own baseline.
Frequently asked questions
How many devices should we use for parallel runs?
Start with three to five. Measure queue wait time and flake rate. Add devices when queue wait time accounts for more than 20% of total pipeline duration. Stop adding when flake rate increases without a corresponding reduction in wall-clock time. Most teams find a practical ceiling between 10 and 20 concurrent sessions for a typical regression suite.
Do parallel runs increase flakiness? How do we prevent it?
Parallel runs don’t cause flakiness, but they expose flakiness that already exists. Tests with shared state, hardcoded waits, or non-unique backend records fail unpredictably under concurrent load. The prevention strategy is isolation: unique test data per session, explicit waits instead of fixed sleeps, and clean teardown after every test.
Can we parallelize Android and iOS together?
Yes. Configure separate shards for Android and iOS with the appropriate platform-specific capability sets. Android sessions need unique systemPort values; iOS sessions need unique wdaLocalPort and udid values. Your CI orchestration can dispatch Android and iOS jobs simultaneously and aggregate results in a final reporting step.
How do we avoid test data conflicts across parallel sessions?
Two reliable approaches: generate unique identifiers at runtime (UUID-based usernames, isolated test tenants, session-scoped sandbox environments) so concurrent sessions never operate on the same backend records. For tests that require pre-existing data, provision that data as part of session setup and tear it down afterward. Static test data shared across sessions is the root cause of most parallel data conflicts.
What if a device is unavailable mid-run?
Configure your test runner to retry the affected shard on a different available device. If you’re using dynamic device pools, the pool manager handles device selection automatically. If you’re using static UDID mapping, add a fallback capability set. At the CI level, mark the shard as a retriable job rather than a hard failure, and ensure your reporting step accounts for retried runs to avoid double-counting failures.
Run your first parallel suite on real devices
Every technique above assumes one thing your test runner cannot provide on its own: reliable concurrent access to real Android and iOS devices, with a session record you can open when a shard fails. That is what Kobiton’s Mobile Device Cloud is for. Start with a free account and run a three-device pilot against your most stable suite, or book a demo to walk through concurrency sizing for your regression suite with an engineer.
Get the Concurrent Device Access Your Test Runner Can’t Provide
- ✓Request a device profile instead of tracking UDIDs — allocation and concurrency handled at the platform layer
- ✓Answer “app bug or infrastructure?” from Session Explorer evidence, not a manual re-run
- ✓Cut per-session duration across every shard at once with Xium, 2-3x faster than standard Appium
- ✓Size your concurrency ceiling with an engineer before you scale the pool