
Every release is a gamble. You add a feature, fix a bug, bump a dependency, and ship it to users who have come to expect a steady stream of improvements. Most of the time the gamble pays off. But sometimes an update quietly takes something away.
The failures everyone worries about are the loud ones: the crash on launch, the checkout button that no longer works, the screen that renders blank. Those get caught because they’re obvious. The failures that slip through are the quiet ones. The app still launches, still checks out, still renders, it just does all of it a little slower than it did last week. Startup creeps from 1.4 seconds to 2.3. A list that used to scroll cleanly now stutters on mid-tier hardware. A long session slowly eats memory until the OS kills the process.
These are performance regressions, and they’re some of the most expensive bugs you can ship, precisely because nothing technically “breaks.” Users don’t file a report that says “startup is 60% slower.” They just open the app, feel the friction, and eventually stop opening it at all. Slow, janky, battery-hungry behavior is one of the most reliable predictors of uninstalls, and app stores fold stability and responsiveness signals directly into ranking, so a degraded build can cost you both retention and discoverability at the same time.
This guide is about catching those regressions before they reach production. We’ll cover what mobile performance regression testing actually is, why mobile makes it uniquely hard, which metrics to watch, how to build a repeatable workflow, and the practices that keep that workflow trustworthy release after release.
Functional regression vs. performance regression: a distinction worth making
Before going deep on performance, it helps to anchor the vocabulary, because “regression testing” gets used loosely.
Regression testing is the practice of re-running tests against existing functionality to confirm that recent changes, new features, fixes, refactors, dependency upgrades, haven’t broken anything that previously worked. Its scope is broad: it covers the unchanged parts of the app, not just the lines you touched. Its goal is system-wide stability across releases.
It’s easy to confuse this with retesting, but the two serve different purposes. Retesting is narrow and targeted: a specific defect was reported, a developer fixed it, and you verify that exact fix. Regression testing is wide and defensive: you make sure the fix (or the new feature alongside it) didn’t introduce side effects elsewhere. Retesting confirms a known problem is gone; regression testing hunts for unknown problems that the change may have created. In a healthy release process you do both.
So far, so functional. Performance regression testing extends this same defensive logic to a different question. Instead of asking “does this feature still work?” it asks “does this feature still work as fast, as smoothly, and as efficiently as it did before?”
That shift matters because a build can pass every functional assertion and still be a regression. If your test suite only checks correctness, a release that pushes cold start from two seconds to four seconds sails straight through, green checkmarks all the way to production. A meaningful slowdown deserves exactly the same level of attention as a failed test, and the only way to give it that attention is to measure performance against a known baseline on every candidate build, not as a one-time pass/fail check.
Why performance regressions are so hard to catch on mobile
If web and desktop teams have it hard, mobile teams have it harder, and the root cause is fragmentation.
Your app doesn’t run in one environment. It runs across a sprawling matrix of devices, chipsets, screen sizes, OS versions, and hardware capabilities, each with its own memory ceiling, CPU profile, and quirks in how the operating system schedules work. A change that’s harmless on a current flagship can be punishing on a three-year-old budget phone with half the RAM. Because of this, a passing result in one environment guarantees nothing about the others, which is what makes mobile regression work so resource-intensive: you’re not validating one target, you’re validating many.
Several specific factors make performance especially slippery:
- Real hardware behaves differently than simulators. Emulators and simulators borrow the CPU and RAM of the powerful machine hosting them. They’re useful for functional logic, but they can’t reproduce thermal throttling, true battery drain, OS-level memory pressure, or the scheduling behavior of constrained hardware. Performance numbers gathered on a simulator are, at best, directional.
- Networks are never the lab network. Real users are on congested LTE, flaky hotel Wi-Fi, and the dead zone between two cell towers. An app validated only on a fast office connection hides every regression that lives in retry logic, timeout handling, and offline recovery.
- The “average” is a trap. Optimizing for median performance feels reasonable and quietly fails a large slice of your users. If your median startup is 1.2 seconds but your 95th percentile is closer to five, a meaningful segment of people is experiencing something near a broken product. Tail behavior, p95 and p99, is where churn is born.
- Cross-platform divergence. A flow that’s smooth on iOS can stutter on Android because of differences in rendering, permissions, or native component behavior, so “tested on one” is never “tested on both.”
The metrics you’re actually regression-testing
You can’t detect a performance regression you aren’t measuring. A solid mobile performance suite tracks indicators across three scopes, device, network, and back-end, because a slow screen can originate in any of them.
User-facing metrics are what people actually feel:
- App startup time, broken into cold start (a fresh launch with no cached state), warm start (the process is in memory), and hot start (resumed from background). Cold start is the first impression, and for most app categories it should land under two to three seconds.
- Time-to-Interactive (TTI) — the moment the app is genuinely usable, not just visually painted. A screen can look ready while still being unresponsive; TTI captures the gap.
- UI smoothness (frame rate) — aim for a steady 60 FPS during scrolling and animation (30 FPS may be acceptable for less demanding screens). Anything lower shows up as jank: stutter, dropped frames, and a cheap-feeling interface.
- Crash rate and ANRs (Application Not Responding events) — the core stability signals. A common industry target is keeping crashes under roughly 1% of sessions. These matter beyond UX, too: Google’s Play Store uses thresholds in the neighborhood of a 1.09% user-perceived crash rate and a 0.47% ANR rate as points where it begins to suppress an app’s visibility.
Resource-usage metrics catch the regressions users feel indirectly:
- CPU usage, where sustained spikes trigger thermal throttling that degrades the whole device and drains the battery.
- Memory usage tracked over time, the only reliable way to surface leaks. Memory that climbs across a long session and never returns to baseline is a leak, and it ends in out-of-memory crashes.
Network metrics expose connectivity-related slowdowns:
- Latency and jitter — round-trip time to your API and the variability in that time. High jitter produces inconsistent, twitchy UI behavior even when median latency looks fine.
- Throughput, request count, and payload size — chatty APIs and oversized responses are a frequent, overlooked cause of slow screen transitions.
- Timeout, retry, and backoff behavior — whether the app degrades gracefully or spirals into a battery-draining retry storm when the network weakens.
Baselines and budgets turn metrics into pass/fail signals
Numbers alone don’t tell you whether you’ve regressed. For that you need two things.
A baseline is a snapshot of how the app performs under normal conditions on a defined set of devices. Without it, you literally cannot say whether a new feature slowed things down, you have nothing to compare against.
A performance budget turns that baseline into a guardrail: a hard limit a release isn’t allowed to cross. For example, startup must stay under two seconds, API responses under 300 milliseconds, scrolling above 55 FPS. When a build blows the budget, you investigate or block it before it ships, rather than discovering the slowdown three releases later in your store reviews.
Mapping regression types and test types to performance work
Two different “type” frameworks are useful here, and they complement each other.
On the regression side, the change you’re shipping dictates how much you re-run:
- Corrective — requirements haven’t changed, so you reuse existing tests to confirm a fix introduced nothing new. Good for small patches.
- Progressive — features or requirements changed, so you author new tests alongside the old ones. The default for an evolving app.
- Retest-all — you re-run everything. Thorough but expensive; reserve it for major releases or large rewrites.
- Selective — you run only the subset tied to what changed. The pragmatic, time-saving middle ground for most builds.
On the performance side, different scenarios demand different methods:
- Load testing — behavior under expected peak traffic.
- Stress testing — pushing past the limit to find the breaking point and confirm graceful recovery.
- Spike testing — sudden surges, the kind a push-notification blast or a viral moment produces.
- Endurance (soak) testing — performance decay and memory leaks over hours of continuous use.
- Network simulation — deliberately degrading the connection to exercise offline modes and retry logic.
- Resource profiling — line-level analysis to find what’s hogging CPU or leaking memory.
For release-time regression work you’ll lean on selective and progressive regression runs paired with targeted load, soak, and network-simulation scenarios on your highest-risk journeys.
A repeatable workflow for performance regression testing
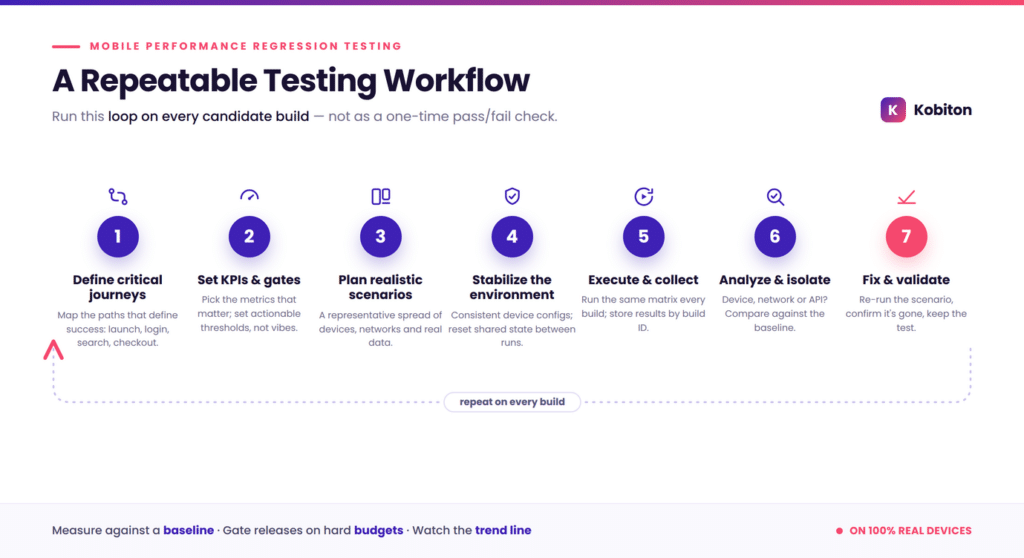
Catching regressions consistently is a process problem, not a heroics problem. A dependable loop looks like this:
- Define critical user journeys. Identify the paths that define success, launch, login, search, checkout, and for each, write down the expectations and the ways it can fail.
- Select KPIs and thresholds. Decide which metrics matter for each journey and set actionable regression gates. “Alert if startup rises more than 10% above baseline” is something you can enforce; “startup should be fast” is not.
- Plan realistic scenarios. Choose a representative spread of devices and network profiles, and use realistic data payloads so you don’t get the classic “fast in test, slow in prod” surprise.
- Stabilize the environment. Minimize noise. Use consistent device configurations and reset shared state between runs so your numbers reflect the build, not the conditions.
- Execute and collect. Run the same scenarios across the same device matrix on every candidate build, and store results indexed by build ID so you can track trends over time.
- Analyze and isolate. When something regresses, triage by scope, is the slowness on the device, in the network layer, or in the API?, then compare against the baseline to pin down the build where it crept in.
- Fix and validate. After a fix, re-run the exact same scenario to confirm the regression is gone, then keep that scenario in the suite so it can’t quietly return.
Best practices that keep the suite trustworthy
A workflow only helps if the tests inside it stay fast, stable, and meaningful. These practices, drawn together from across the discipline, are what separate a suite teams rely on from one they learn to ignore.
Prioritize critical flows, but keep pushing coverage. You can’t validate every flow on every device, so start with the journeys that carry the most user and business value: authentication, onboarding, payments, account management. That said, don’t treat “critical flows only” as a permanent ceiling. Modern AI-assisted tooling makes it far cheaper to author and run tests than it used to be, so reinvest the time you save into widening coverage and shrinking your defect-escape rate.
Anchor tests to user intent, not brittle selectors. One of the biggest sources of instability is coupling tests to resource IDs, accessibility IDs, or deeply nested view hierarchies. Mobile UIs change constantly, and a small refactor can shatter a swathe of tests even when the user-visible experience is unchanged. Frame tests around intent, “can the user log in,” “can they complete checkout,” “can they recover from a dropped connection”, so they survive cosmetic implementation changes.
Establish baselines and enforce budgets. Treat the baseline as a living artifact and let your budgets gate releases automatically. A build that exceeds a hard threshold should be flagged before a human has to notice.
Test on a tiered real-device matrix. Full coverage of every device is impossible, so structure it deliberately:
- Core devices — your highest-traffic models, run on every build.
- Constrained devices — deliberately low-end hardware that exposes problems which never surface on developer machines.
- Latest-OS tier — fresh OS releases, to catch compatibility regressions introduced by the platform itself.
- Long-tail rotation — niche and older devices covered on a schedule rather than every build.
Validate real-world conditions. Ideal-lab results lie. Exercise your flows under slow and unstable networks, varying battery states, interrupted sessions, low storage, backgrounding and app-switching, device rotation, offline-to-online sync, and multiple OS versions, and confirm cross-platform consistency between iOS and Android.
Keep the suite fast, and give performance its own pipeline. If a regression run takes hours, people run it less often and stop shifting it earlier. Separate smoke tests from full suites, run critical-path checks on every pull request, parallelize aggressively, and trim redundant setup and overlap. Because performance tests need more time and controlled conditions to produce reliable numbers, house them in a dedicated pipeline triggered at intentional points, before a feature branch merges, ahead of a release candidate, or nightly, rather than on every single commit. That keeps your main pipeline quick while still catching regressions early.
Take flaky tests seriously. The moment engineers start dismissing failures as “just another flaky test,” the suite loses its value. Mobile is inherently more flake-prone thanks to network variability, rendering differences, interruptions, and OS permission popups. Resist the urge to paper over it with retries. Instead, track flake rates over time, quarantine unstable tests immediately, standardize test data and environments, wait for stable UI states instead of inserting arbitrary sleeps, and lean on self-healing, intent-based locators to cut maintenance churn.
Shift left. The earlier a regression is caught, the cheaper it is to fix. Pull-request validation, pre-merge checks, feature-branch runs, and nightly schedules all prevent a backlog of regressions from piling up at the end of a cycle. Performance work shifts left too, just within its dedicated pipeline and against stable baselines.
Add a regression test every time something breaks. Bugs will escape; that’s a given. When you fix one, write a test that reproduces it and add it to the suite. Do this consistently and you accumulate a library of regression coverage that maps precisely to the ways your app has actually failed.
Build maintainable architecture from day one. The cheapest maintenance burden is the one you never create. Reusable modules, shared setup utilities, centralized test data, consistent naming, clear ownership, and version-controlled assets keep suites from rotting. AI tooling can ease the upkeep, but no platform fully prevents a suite from degrading without human review, so schedule regular pruning of duplicates, slow paths, and redundant assertions.
Watch for slow drift, not just hard breaches. Some of the most dangerous regressions never trip a single threshold. Each build stays within budget, but the cumulative slide over months is significant. Track your KPIs as time series and alert on the slope, not just the absolute value, so gradual decay gets caught before it compounds into a genuinely slow app.
Performance regression testing in CI/CD
Tying this into your delivery pipeline is what makes it continuous rather than occasional. The pattern that works:
- Keep performance tests in a separate pipeline from your fast functional suite, triggered at merge and pre-release gates and on a nightly cadence.
- Gate releases with hard thresholds (“fail the build if cold start exceeds two seconds”) so regressions are blocked automatically.
- Treat test stability as a prerequisite, performance measurements have natural variance, so use warmup iterations, repeat runs, and variance limits to make sure a failure is signal rather than noise.
- Layer trend monitoring on top to catch the gradual drift that point-in-time thresholds miss.
Common performance regressions and how to diagnose them
Most regressions fall into recognizable patterns, and knowing the pattern points you at the cause:
- Slow load times — separate network latency, back-end response time, and client rendering before you guess. If the data arrives quickly but the screen stays blank, the problem is client-side.
- Startup regressions — almost always trace to initialization work added by a new feature: a heavy SDK, an analytics call, or a blocking network request that wandered into the launch path.
- Jank and dropped frames — point to main-thread contention. Profile to see whether non-UI work like file I/O or data processing is blocking the thread.
- Memory growth over a long session — run an endurance test. If memory never returns to baseline after a task completes, you have a leak.
The tooling landscape
No team should hand-roll a test framework from scratch; the ecosystem is mature. On the automation side, the common building blocks are Appium (one API across Android and iOS), XCUITest/XCTest (Apple’s native framework), and Espresso (Android’s native framework), with end-to-end and React Native–oriented options filling specific niches. For the back-end pillar, load generators simulate concurrent traffic to see how server behavior shapes client-side performance.
But frameworks are only the scripting layer. The factor that most determines whether your performance numbers are real is where the tests run. Because simulators can’t reproduce thermal throttling, true battery behavior, or constrained-hardware memory pressure, accurate performance regression testing depends on real devices at scale, plus standardized network profiles and CI/CD integration to make the whole thing repeatable.
How Kobiton supports mobile performance regression testing
This is where a real-device platform earns its place in the pipeline. Kobiton is built around exactly the conditions performance regressions hide in:
- 100% real devices, in the cloud or on-premises. Kobiton runs tests on hundreds of actual iOS and Android devices rather than emulators, surfacing the device-specific battery, memory, network, and rendering issues that simulators structurally can’t. You can use the public cloud, reserve private devices, or “cloudify” your own local lab for full control.
- AI-powered automation that fights flakiness. Scriptless test automation lets developers, QA, and even non-technical stakeholders build automated tests from manual sessions without writing code, while Appium self-healing keeps those tests running as UI elements shift, directly attacking the brittle-selector and maintenance problems that erode regression suites.
- Performance anomaly detection. Kobiton’s AI engine monitors CPU, memory, and battery behavior and flags anomalies, the kind of resource regressions that pass every functional check, alongside the launch-time, FPS, latency, and ANR/crash signals that define mobile performance.
- First-class CI/CD integration. Direct hooks and REST APIs slot performance and regression runs into your existing pipelines, so checks fire at the merge and pre-release gates where they belong, and results surface where engineers already work.
- Faster cycles and clearer diagnosis. With AI-accelerated script execution and a session explorer that lets you replay a run to pinpoint exactly where a regression appeared, the loop from “a build slowed down” to “here’s the cause” gets dramatically shorter.
Performance regressions are quiet, expensive, and easy to ship if your testing stops at “does it work.” The teams that avoid them are the ones that measure against a baseline on real devices, gate releases on hard budgets, and watch the trend line as closely as the threshold, every update, every release.
