Mobile App Crash Testing How to Find, Reproduce, and Fix Crashes Before Your Users Do
Most mobile teams treat crashes as an incident to respond to. A dashboard spikes, someone opens the stack trace, a hotfix goes out, and the number comes back down.
That model is expensive, and it is backwards. By the time a crash appears on a dashboard, it has already reached real users, and mobile users are unusually unforgiving. A 2026 Luciq survey of more than a thousand US mobile users found that roughly 15% will uninstall an app after a single crash, and more than half walk away after two or three. Industry stability research has drawn a similar line on ratings: apps that fall below a 99.7% crash-free rate tend to sit under three stars. Broader retention data puts around 28% of users uninstalling an app within thirty days of installing it, with instability a leading contributor.
The app stores have codified this. Google Play’s quality program flags apps whose user-perceived crash rate exceeds 1.09% of daily active users, and a single device model crossing an 8% crash rate can put a warning on your store listing. The ANR (Application Not Responding) threshold sits at 0.47%. Cross those lines and you do not just annoy users your discoverability suffers.
Crash testing is the discipline that moves crash discovery from production back into your pipeline. This guide covers what it is, why apps crash, where standard test suites leave gaps, how to build a crash test matrix, how to instrument crash reporting properly, and the QA workflow for turning a crash report into a verified fix.
What Is Mobile App Crash Testing?
Mobile app crash testing is the deliberate practice of driving an application into failure conditions resource exhaustion, degraded networks, malformed backend responses, interrupted lifecycles, unsupported hardware to find the paths where it terminates unexpectedly, and then verifying it degrades gracefully instead.
It differs from functional testing in one important way. Functional testing asks does the feature work when everything is available? Crash testing asks what happens when something is not?
That distinction matters because crashes almost never live on the happy path. An app that passes every acceptance criterion on a flagship device with office Wi-Fi and a warm cache can still die on a three-year-old mid-range phone that just switched from Wi-Fi to cellular with 4% battery remaining and 200 MB of free storage. Crash testing is the work of building that second scenario on purpose.
It also spans a wider surface than most test plans account for. Crash testing is not one test type it is a lens applied across compatibility testing, performance testing, interruption testing, network simulation, soak testing, negative testing, and exploratory testing.
The Failure Modes You Are Actually Testing For
“Crash” is a loose word. Diagnosing and testing effectively requires distinguishing between failure modes, because each has different triggers, different signatures in your logs, and different reproduction strategies.
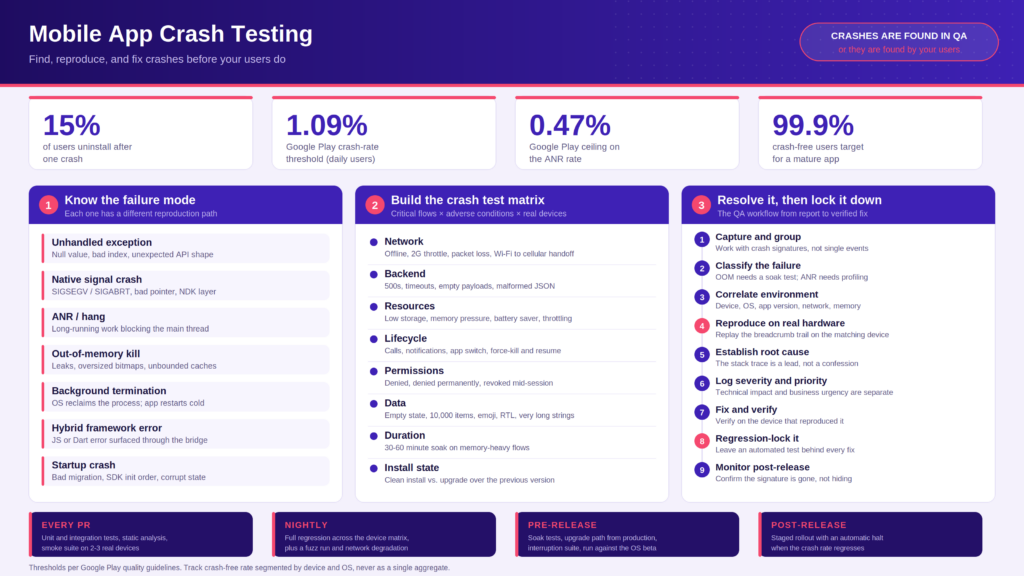
| Failure mode | What it looks like | Typical trigger |
| Unhandled exception | App terminates instantly, stack trace points to a specific line | Null value, index out of range, unexpected API shape, failed type cast |
| Native signal crash | SIGSEGV, SIGABRT, EXC_BAD_ACCESS in the report | Memory corruption, bad pointer, native/NDK or C++ layer fault |
| ANR / hang | UI frozen, system offers to close the app | Long-running work on the main thread large parse, DB query, image processing, synchronous network call |
| Out-of-memory termination | App disappears with no stack trace | Memory leak, retained references, oversized bitmaps, unbounded caches |
| Background / watchdog termination | App restarts from scratch when resumed | OS reclaims the process; excessive background work; exceeded launch or background execution budget |
| Hybrid framework errors | JS exception or Dart error surfaced through a bridge | React Native, Flutter, or WebView layer failing above the native runtime |
| Startup crash | App dies before the first screen renders | Bad migration, failed config fetch, SDK init order, corrupted local state after upgrade |
Startup crashes deserve special attention. They are the most damaging class of failure the user cannot even reach the app to work around it and they are also the most likely to go unreported, because a crash reporting SDK that has not finished initializing cannot capture the crash that killed the process before it.
12 Root Causes of Mobile App Crashes and What to Test for Each
1. Device fragmentation and hardware incompatibility
Android is the harder problem here: manufacturers ship modified builds, and RAM, chipsets, GPUs, screen geometries, and OEM power-management policies vary enormously. An app that is stable on a Samsung flagship can fail on a Pixel or a budget device with 3 GB of RAM. iOS is narrower but fragments across OS versions and older hardware.
Test for it: Build a device matrix from your actual install-base analytics, not from what is on engineers’ desks. Deliberately include low-end and older devices that is where memory and CPU ceilings get hit first. Cover different screen densities and aspect ratios, and any hardware your app depends on (camera, GPS, biometrics, Bluetooth, NFC).
2. Emulator-only testing
Emulators are excellent for fast development loops and terrible at reproducing what breaks in the field. They do not faithfully model thermal throttling, real memory pressure, sensor behavior, OEM permission dialogs, battery states, hardware camera pipelines, or genuine touch input.
Test for it: Use emulators for speed during development; use real devices for compatibility, performance, regression, and release-gate testing. A camera or biometric feature that passes on a simulator tells you almost nothing.
3. Unpredictable and changing network conditions
Most testing happens on fast, stable office Wi-Fi. Users are on congested public networks, weak 3G, dead zones, and elevators and, critically, they transition between them mid-session. Packet loss and connection handoffs are where naive network code throws.
Test for it: Simulate throttled bandwidth, high latency, and packet loss using network shaping, Charles Proxy, or Network Link Conditioner. Then test the transitions: Wi-Fi → cellular, connected → airplane mode → reconnected, mid-upload disconnection. Verify the app caches sensibly, retries with backoff, surfaces a recoverable error state, and works offline where the feature allows it.
4. Memory leaks and poor memory management
Memory issues start invisibly and compound. Retained listeners, undisposed observers, oversized bitmaps, and unbounded caches gradually push the app toward an OOM kill often after twenty minutes of use, which is exactly the duration a five-minute smoke test never reaches.
Test for it: Profile with Android Profiler and Xcode Instruments under realistic workloads. Run soak tests: keep a session alive for 30–60 minutes cycling through memory-heavy flows and watch whether the baseline climbs. Re-check memory after every feature addition, not once a quarter.
5. Unhandled exceptions and bad input data
Exceptions in production are inevitable. Crashes happen when an exception reaches a point where nothing catches it. The classic case: the app assumes an API always returns a complete object, the API returns null or a partial response, and the app dereferences a field that does not exist.
Test for it: Negative and boundary testing. Empty fields, null responses, wrong types, oversized payloads, special characters, emoji, right-to-left text, extreme numeric values, expired tokens, denied permissions. Validate API responses before consuming them. Avoid catch-all exception handling that swallows the cause without logging it.
6. Inefficient code and main-thread blocking
Slow code does not always crash directly, but it creates the conditions for crashes and ANRs. Parsing a large response, resizing high-resolution images, or querying a big local database on the main thread will block the UI. On Android, sustained blocking triggers an ANR. On iOS, excessive resource use can get the app terminated by the system. Fast development hardware hides all of this.
Test for it: Profile on mid-range and low-end devices, not just your dev phone. Look for main-thread work, redundant computation, frequent garbage collection, expensive queries, and background tasks that outlive their usefulness.
7. Backend and API failures
Servers under load return 5xx errors, time out, or send truncated responses. Excessive load rarely crashes the app by itself the crash comes from the app not handling what a degraded backend sends back. An e-commerce checkout that continues with missing pricing data will crash the moment it reads a field that never arrived.
Test for it: Mock and inject failure. Force 400s, 500s, timeouts, empty arrays, and malformed JSON. Define request timeouts. Cap retries so a failing service does not turn into a self-inflicted DDoS. Test that dependent screens show a recoverable error rather than proceeding with missing data.
8. OS updates and deprecated APIs
Every major Android and iOS release changes behavior background execution limits, permission models, storage scoping, notification handling. Apps relying on deprecated APIs break.
Test for it: Join the OS beta programs. Run your regression suite against beta builds before public release. Maintain a documented minimum supported OS version and test against both ends of that range.
9. Third-party SDK and dependency changes
Analytics, payment, ads, auth, and mapping SDKs update on their own schedules. A dependency bump that works on current devices may call an API that behaves differently on an older OS a combination that only surfaces if that pairing is in your device matrix.
Test for it: Upgrade dependencies in isolation, not bundled into a big feature release. Track SDK changelogs and deprecations. Prefer libraries with active maintenance. Regression-test the flows each SDK touches.
10. Rapid release cadence and regression debt
Agile release cycles are not the problem; untested interactions between simultaneous changes are. A new feature, a dependency upgrade, an API contract change, and a new OS version can each be individually fine and collectively fatal.
Test for it: Treat every release as a regression and compatibility exercise, not just feature validation. Run regression suites over flows the change touches directly and indirectly. Automate the critical path in CI so it runs on every relevant commit.
11. UI, layout, and rendering problems
Apparently cosmetic issues escalate. Broken layouts on unusual aspect ratios, memory-heavy animations, unconstrained lists, and rendering work that blocks the main thread all convert into freezes and crashes.
Test for it: Follow Material Design and Human Interface Guidelines many of the constraints exist precisely to prevent these failures. Test rotation, split-screen, foldable states, font scaling, and dark mode. Keep layout hierarchies shallow, compress image assets, and push heavy work off the render thread.
12. Background execution, battery, and permission handling
Frequent GPS polling, wake locks, continuous sync, and long-running background jobs drain battery and get throttled or killed by the OS. Code that assumes a background task always completes will fail when it does not. Runtime permission denials and revocations are a related trap.
Test for it: Run long-session battery and background tests, not just short functional passes. Force-kill the app and resume. Deny each permission and revoke permissions mid-session. Verify state restoration after the OS reclaims the process.
One more worth adding, because almost nobody tests it: the upgrade path. A clean install is not the same code path as an in-place update over an old version with existing local data, a stale cache, and an outdated schema. Migration crashes hit your most loyal users first. Always test installing the previous production build, generating real data, then upgrading over it.
The 7 Testing Gaps That Let Crashes Ship
If you already run a solid functional suite and still see crashes in production, the problem is usually structural rather than a missing test case. These are the recurring gaps:
- Happy-path bias. Test cases are written from acceptance criteria, and acceptance criteria describe success. Nobody wrote a ticket for “API returns null.”
- Ideal-conditions bias. Fast Wi-Fi, charged battery, plenty of storage, warm cache, freshly launched app.
- Coverage skewed to premium hardware. The devices your team owns are not the devices your users own.
- No interruption testing. Calls, notifications, alarms, app switching, backgrounding mid-transaction, force-kill and resume.
- No duration. Every test session is short, so leaks and accumulation never surface.
- No low-resource testing. Low storage, low memory, low battery, battery saver mode, and thermal throttling are all crash accelerants that never appear in a test plan.
- No upgrade-path testing. Everything is tested as a clean install.
Fixing these gaps closes the large majority of realistic crash scenarios and none of them require a new tool, just a broader definition of what a test run covers.
Building a Crash Test Matrix
A crash test matrix is a deliberate cross-product of flows × conditions × devices. Take your critical user journeys, cross them against adverse conditions, and execute across a representative device set.
Conditions to cross against every critical flow
| Category | Scenarios to execute |
| Network | Offline, 2G/3G throttling, high latency, packet loss, Wi-Fi ↔ cellular handoff, disconnect mid-request, captive portal |
| Backend | 500 errors, timeouts, empty payloads, malformed JSON, unexpected schema changes, expired auth token |
| Resources | Low storage (<500 MB), low memory pressure, battery saver, thermal throttling, background app pressure |
| Lifecycle | Incoming call, notification, alarm, app switch, backgrounding mid-transaction, force-kill and resume, device rotation, OS reboot |
| Permissions | Denied at first prompt, denied permanently, revoked mid-session, granted then revoked in settings |
| Data | Empty state, single item, 10,000 items, very long strings, emoji, RTL text, special characters, invalid formats |
| Duration | 30+ minute soak on memory-heavy flows, repeated navigation cycles, extended background residency |
| Install state | Clean install, upgrade from previous version, upgrade from two versions back, reinstall over existing data |
Techniques that pair with the matrix
- Monkey / fuzz testing randomized input at high volume finds sequences no human would script. Cheap to run in CI, and effective at surfacing unhandled exceptions.
- Exploratory testing the counterweight to automation. Crash reporters record failures that happen; they cannot invent the weird scenarios that cause them. Every unusual crash worth writing a case study about was found by a human being curious.
- Soak / endurance testing the only reliable way to surface leaks.
- Interruption testing systematically covering the lifecycle table above.
- Beta and field testing a controlled pre-release population running on hardware and networks you cannot replicate internally.
Choosing devices
Do not test everything. Prioritize by real coverage:
- Top device models by share in your own analytics
- Your oldest supported OS version and the newest (including the current beta)
- At least two low-end / low-RAM devices
- Devices representing each hardware capability your app depends on
- Any device model already showing an elevated crash rate in production data
Crash Reporting: Instrumentation That Actually Diagnoses
Testing catches what you thought to look for. Crash reporting catches what you did not. You need both, and the reporting side needs a strategy a badly configured premium tool loses to a well-run free one every time.
What a usable crash report contains
- Stack trace the code path at the moment of failure, ideally down to file and line
- Breadcrumbs a chronological log of user actions leading up to the crash
- Environment snapshot device model, OS version, app version, orientation, free memory, storage, battery level, network state
- Custom keys user tier, feature flags, A/B variant, locale, logged-in state
- Grouping and impact data how many users and sessions each crash signature affects
A six-step reporting strategy
Step 1 Instrument early and establish a baseline. Initialize the crash SDK as early in the app lifecycle as possible. If a fatal error occurs during boot before the reporter is live, the crash is invisible you get a silent failure and an uninstall you cannot explain. Then run the instrumented build through normal, crash-free usage across your test devices to establish what “healthy” looks like, so you can recognize an anomaly when a new build ships.
Step 2 Turn stack traces into root-cause maps. Configure symbolication for iOS and deobfuscation mapping for Android, or your traces are unreadable addresses. Caveat: a stack trace tells you where, not always why. A null value, a race condition, and a misbehaving third-party SDK can all surface at the same line. Treat the trace as your strongest lead, not a confession.
Step 3 Use breadcrumbs to reproduce. The hardest part of QA is reconstructing the exact sequence of taps, swipes, and background switches that produced a failure. Breadcrumbs record it automatically. A crash that only fires after a user opens a side menu, navigates three screens deep, and triggers a copy action is effectively unreproducible without them. Caveat: breadcrumbs only log what you told them to log map your critical steps in advance.
Step 4 Use environment snapshots to beat fragmentation. Snapshots tell you instantly whether a bug is global or isolated to one corner of the device matrix, which saves hours of blind cross-device testing. Segment Android and iOS separately rather than averaging them; Android’s long tail of older hardware and iOS’s clustering around OS versions are different problems. Caveat: snapshots only describe devices that actually ran your app. If your users skew toward hardware you never test, you are blind on exactly the phones most likely to fail.
Step 5 Triage by user impact, not by volume or volume of complaints. Good dashboards group identical crashes and attach impact metrics, letting you distinguish “500 occurrences across 120 users” from “happened once, ever.” Sort your backlog by who and how many. A crash hitting 2% of daily users on a popular device is a release blocker; a crash firing once on a rooted device in airplane mode is a footnote. Caveat: raw counts mislead. A low-volume crash on your checkout screen can outrank a high-volume crash on a settings page nobody visits. Weigh frequency against business context.
Step 6 Pair automated reporting with human testing and regression. After a fix ships, the same crash data confirms the signature actually disappeared rather than merely hiding. And during beta runs, you can filter the dashboard by a tester’s device or user ID and get full diagnostics without interviewing anyone.
Tooling landscape
| Tool | Best for |
| Firebase Crashlytics | Free, lightweight, strong default especially for teams already on Firebase |
| Sentry | Cross-platform error and performance monitoring with deep release tracking; can feel heavy for non-technical stakeholders |
| Bugsnag (SmartBear) | Stability scores and customizable workflows; appeals to larger teams wanting one clear release-health number |
| Luciq | Crash reporting paired with in-app user feedback technical trace plus human context |
| Embrace | Full mobile observability: sessions, ANRs, frozen frames across iOS and Android |
The tool only reports what you set it up to capture. Strategy beats the logo.
The QA Workflow for Resolving a Crash
Resolving a crash differs from a standard bug cycle, because a crash report is a symptom cluster rather than a single reproducible defect. This is the workflow:
1. Capture and group. Let the reporter deduplicate identical signatures. You are working with crash groups, not individual events.
2. Classify the failure type. Unhandled exception, native signal, ANR, OOM, background termination, startup crash. This determines your reproduction approach an OOM needs a soak test, an ANR needs main-thread profiling.
3. Correlate against environment variables. Cross the group against device model, OS version, app version, network state, memory, and storage. The goal is to rule in or rule out device- and network-side causes before you go looking in the code. If 94% of a group lands on one OEM at one OS version, you have your reproduction target.
4. Reproduce on a real device. Take the breadcrumb trail, load the matching device and OS version, replicate the environment (throttled network, constrained memory), and drive the sequence. This is the step that converts “it broke somewhere” into “it broke in this method, here is the video.”
5. Establish root cause. The stack trace is the lead. Confirm it a race condition or an SDK defect can present identically to a null dereference.
6. Log with severity and priority separated. Severity is technical impact; priority is business urgency. A crash-on-launch is severity-critical regardless of how many users hit it. A crash affecting 3% of users mid-checkout may be lower severity and higher priority. Run the standard defect lifecycle from there: New → Assigned → In Progress → Fixed → Retest → Verified → Closed, with Reopened, Deferred, and Rejected as branches.
7. Fix and verify on the reproducing device. Verification on a different device than the one that reproduced it is not verification.
8. Regression-lock it. This is the step teams skip and pay for later. Every resolved crash should leave behind an automated test that reproduces its trigger conditions. Otherwise the same defect returns in three releases when someone refactors the surrounding code.
9. Monitor post-release. Confirm the crash signature actually vanished in the new version’s data, and watch for whether the fix introduced a new one.
Crash Metrics Worth Tracking
| Metric | What it measures | Reasonable target |
| Crash-free users % | Share of users who experienced no crash in a period | 99.5%+ minimum; 99.9% for mature apps |
| Crash-free sessions % | Share of sessions ending without a crash | 99.9%+ |
| User-perceived crash rate (Android Vitals) | Daily users hitting at least one foreground crash | Below 1.09% (Google Play threshold) |
| ANR rate | Daily users experiencing at least one ANR | Below 0.47% (Google Play threshold) |
| Per-device crash rate | Crash rate isolated to a single device model | Below 8% on any model (Play listing warning threshold) |
| Startup crash rate | Crashes before first meaningful render | As close to zero as possible treat any regression as a blocker |
| MTTD / MTTR | Time to detect and to resolve a crash | Track the trend; the absolute number matters less than the direction |
Track crash-free rate segmented by device and OS, not just as an aggregate. A healthy 99.6% overall can conceal a 91% crash-free rate on one popular device that is quietly destroying your ratings.
Shifting Crash Testing Into CI/CD
Crash testing only scales if it runs without someone remembering to run it.
- On every PR: unit and integration tests, static analysis, a smoke suite on two or three real devices.
- Nightly: the full regression suite across the device matrix, plus a monkey/fuzz run and network-degradation scenarios.
- Pre-release: soak tests, upgrade-path tests from the previous production build, interruption suite, and a run against the current OS beta.
- Gates: block the release if crash-free rate on the release candidate drops below your threshold, if any new startup crash appears, or if ANR rate regresses.
- Post-release: staged rollout with automated halt criteria tied to crash rate, so a bad build stops at 5% of users instead of 100%.
How Kobiton Fits Into Crash Testing
Most of what makes crash testing hard is logistical: getting the right physical device, reproducing the exact conditions, and capturing enough context that a developer does not have to reproduce it a second time.
Koobiton addresses that directly:
- Real device cloud, public or private. Test on the actual iOS and Android hardware your users own, including older and lower-end models where memory and CPU limits get hit first. On-premises and private cloud deployments are available for teams with data-residency or security constraints.
- Session Explorer. An iMovie-style timeline of the session that correlates CPU, memory, network, battery, and temperature metrics to exact moments, so you can see the resource curve leading into a failure rather than just the endpoint. Screens exceeding load-time thresholds are flagged directly on the timeline.
- Crash, device, and Appium logs in one place. Advanced crash detection surfaces not just that a crash happened but the surrounding context needed to explain why.
- Network payload capture with HAR export. Analyze request/response payloads and timings for backend-triggered crashes, and export for deeper root-cause work.
- Network shaping and geolocation. Reproduce degraded and regional conditions on real hardware instead of hoping a simulator approximates them.
- One-click Jira filing. Tickets pre-populate with a deep link to the exact test step, device info, OS, resolution, logs, crash logs, and Appium logs which removes most of the back-and-forth between QA and engineering.
- AI-driven and scriptless automation. Convert manual sessions into reusable scripts and run them across the device matrix, with self-healing to reduce maintenance on the regression suites that keep resolved crashes from returning.
- CI/CD integration. Jenkins, GitHub Actions, CircleCI, Azure DevOps, GitLab, Bitrise, TeamCity, TestRail, and a REST API for anything else.
The practical effect is that steps 3 through 8 of the resolution workflow correlate, reproduce, root-cause, verify, regression-lock happen on real hardware with full context, instead of in a Slack thread that starts with “can’t reproduce.”
FAQ
What is an acceptable crash rate for a mobile app?
Aim for a crash-free user rate of 99.5% at minimum, and 99.9% for a mature app. Google Play treats a user-perceived crash rate above 1.09% of daily active users as a bad-behavior threshold, with a separate 0.47% ceiling on ANRs. Many teams set an internal target well below those, since store thresholds are a floor, not a goal.
What is the difference between crash testing and stress testing?
Stress testing pushes an app beyond expected load to find its breaking point. Crash testing is broader: it covers stress, but also compatibility, interruption, network degradation, bad data, and lifecycle scenarios. Stress testing is one technique inside crash testing.
Can crash testing be fully automated?
No. Automation covers regression, fuzz input, network degradation, and matrix execution efficiently. But crash reporters record failures that occur they cannot imagine the scenarios that cause them. The most damaging crashes tend to be found by humans doing exploratory testing on real devices, then locked down with automation afterward.
Why does my app crash only in production?
Almost always because production conditions are not present in your test environment: older devices, weaker networks, real backend load, accumulated local data, denied permissions, low storage, and long sessions. Bringing those conditions into testing is precisely the point of a crash test matrix.
Do emulators work for crash testing?
For a fast development loop, yes. For crash testing specifically, no. Emulators do not reproduce thermal throttling, genuine memory pressure, OEM power management, hardware sensor behavior, or real touch input and those are where a disproportionate share of crashes originate.
How do I reproduce a crash I only see in the dashboard?
Read the environment snapshot to identify the device and OS combination, follow the breadcrumb trail for the exact action sequence, replicate the environmental conditions (network state, memory pressure, battery level), and run it on matching real hardware. If it still will not reproduce, the cause is likely a race condition or timing-dependent try it under CPU load or on slower hardware.
Conclusion
Crashes are rarely traceable to a single defect. They emerge from the intersection of code, device, network, backend, and operating system which is exactly why a build that looks stable in development can fail the moment it meets constrained memory, an unexpected API response, or a device configuration nobody tested.
The teams that keep crash rates low are not the ones with the best crash dashboards. They are the ones that treat crash testing as a design decision: broadening the definition of a test run to include adverse conditions, running on the hardware their users actually own, instrumenting reporting so a crash arrives already half-diagnosed, and leaving an automated regression test behind every fix.
Do that consistently and the dashboard becomes a confirmation of what you already knew, rather than the first place you find out.
