Your app can pass every functional test you throw at it and still lose users. Not because a button is broken, but because checkout takes six seconds on a 4G connection during a flash sale, or because the API that felt instant with 50 testers falls over at 5,000 concurrent sessions.
Mobile performance is unforgiving in a way desktop performance never was. Users are on a bus, on a spotty connection, on a three-year-old mid-range Android, with fourteen other apps competing for memory. A one-second delay is enough to push them back to the app store.
Apache JMeter is the most widely used open-source tool for pressure-testing the server side of that equation. For teams exploring JMeter mobile performance testing, this guide walks through how to use it for mobile apps end to end — from building a load profile, through proxy recording and script correlation, to execution, throttling, and analysis. It also draws a clear line around what JMeter cannot tell you, and what you need alongside it.
The JMeter mobile testing workflow
Twelve stages from load profile to real-device validation. Pick a stage to see what to do, which JMeter elements to use, and what usually goes wrong.
1. What mobile performance testing actually measures
"Performance testing" is an umbrella. For mobile, it splits cleanly into two halves, and confusing them is the single most common mistake teams make.
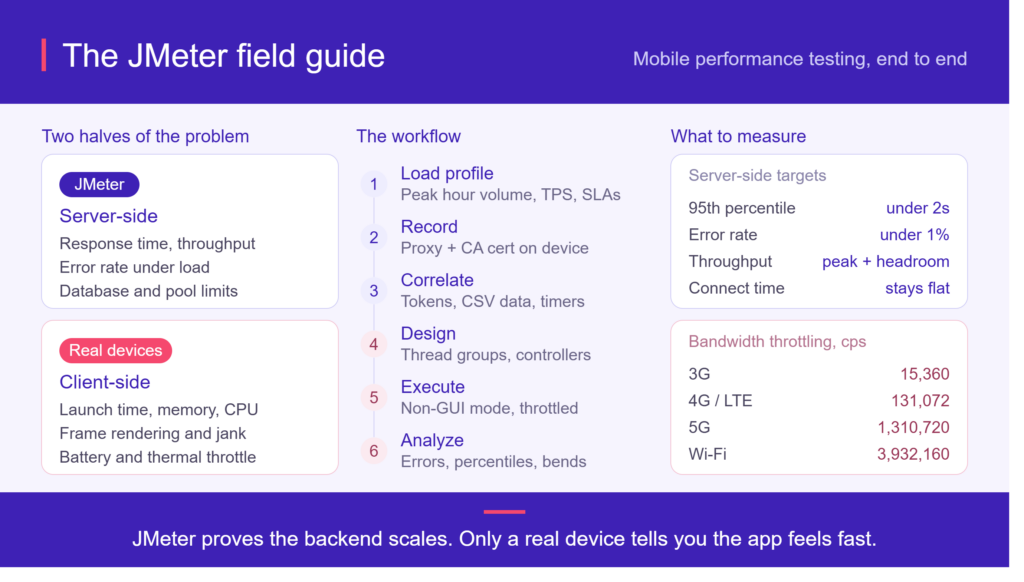
Server-side performance is how your backend behaves when thousands of app instances hit it simultaneously. Response times, throughput ceilings, error rates under load, database contention, connection pool exhaustion. This is protocol-level work — HTTP/HTTPS requests going in, JSON coming back.
Client-side performance is how the app behaves on the device itself. App launch time, frame rendering, memory footprint, CPU spikes, battery drain, thermal throttling, behavior when the OS kills a background process. This is device-level work and requires the app actually running on hardware.
JMeter owns the first half completely and cannot touch the second. Keep that distinction in mind for the rest of this guide.
Application types matter
| App type | What JMeter can test | What it can't |
| Native (Swift/Kotlin) | All REST/GraphQL API traffic between app and backend | UI rendering, memory, battery, native crashes |
| Hybrid (React Native, Flutter, Ionic) | API traffic, plus any web content fetches | Bridge overhead, JS thread blocking, rendering |
| Mobile web / PWA | Full page loads, assets, API calls | Browser rendering, JS execution, service worker behavior |
| Real-time (chat, trading, gaming) | WebSocket/MQTT via plugins, message throughput | True concurrent socket state at device level |
2. Where JMeter fits — and where it doesn't
JMeter started as a web application load tester and grew into a general-purpose protocol testing tool. For mobile, its strengths are specific and real:
- Realistic traffic simulation. You record an actual user journey from an actual device and replay it at scale — login, browse, add to cart, checkout — so your load resembles production rather than a synthetic guess.
- Protocol coverage. HTTP/HTTPS out of the box, which covers the vast majority of mobile backend communication. FTP, JDBC, JMS, and WebSocket/MQTT via plugins.
- Scale on modest hardware. A properly tuned JMeter instance in non-GUI mode handles thousands of threads. Distributed mode multiplies that.
- Extensibility. The Plugins Manager gives you Ultimate Thread Group, Stepping Thread Group, PerfMon server monitoring, custom graphs, and dozens more.
- CI/CD integration. Runs headless from the command line, which means it drops straight into Jenkins, GitHub Actions, or GitLab CI as a quality gate.
- Free and open source. No per-virtual-user licensing, which changes the economics of running large tests frequently.
The honest counterweight — JMeter does not:
- Simulate device CPU, memory, or battery constraints
- Render UI or measure anything a user visually experiences
- Execute client-side JavaScript (it fetches resources; it doesn't run them)
- Handle heavily obfuscated or certificate-pinned traffic without developer cooperation
- Auto-correlate dynamic values the way commercial tools attempt to
Rule of thumb: JMeter tells you whether your backend survives 10,000 users. It tells you nothing about whether the app feels fast in a user's hand. You need both answers.
3. KPIs worth tracking
Define these before you write a line of script, and agree on thresholds with the product owner. Untargeted tests produce data nobody acts on.
Server-side (JMeter measures these directly)
| Metric | What it tells you | Typical target |
| Average response time | Baseline health of an endpoint | Depends on endpoint criticality |
| 90th/95th/99th percentile | What your unlucky users experience | 95th < 2s for interactive calls |
| Throughput (req/sec) | Capacity ceiling of the system | Must exceed peak-hour projection + headroom |
| Error rate | Failures under load | < 1% under expected peak |
| Latency vs. connect time | Separates network from processing | Connect time should stay flat |
| Transactions per second | Business-level capacity | Tied to business SLAs |
Always report percentiles, not just averages. An average of 800ms can hide a 99th percentile of 9 seconds — and that tail is where your churn lives.
Client-side (requires device-level tooling)
| Metric | Why it matters |
| App launch time (cold/warm) | First impression; heavily weighted in store rankings |
| Memory footprint | Predicts OOM kills on low-end devices |
| CPU utilization | Correlates directly with battery drain and thermal throttling |
| Frame rendering / jank | Perceived smoothness — dropped frames feel like lag |
| Battery consumption | A top-three driver of one-star reviews |
| Network payload size | Data cost for users on metered plans |
Infrastructure (via PerfMon, Grafana, or your APM)
CPU, memory, disk I/O, network I/O on app servers; database query time, connection pool utilization, cache hit ratio, garbage collection pauses.
4. Prerequisites before you script anything
Getting these wrong causes most of the "why won't my recording work" pain later.
Software
- JDK 8 or later — JMeter is a Java application and will not start without it. Verify with java -version.
- Apache JMeter — download the binary from the official Apache mirrors and unzip it. Launch bin/jmeter.bat (Windows) or bin/jmeter.sh (macOS/Linux).
- JMeter Plugins Manager — drop jmeter-plugins-manager.jar into lib/ext/. You'll want it for thread groups and monitoring.
Environment
- A dedicated test environment that mirrors production topology. Testing against production is a career-limiting move; testing against a laptop-sized staging environment produces numbers you can't extrapolate.
- Test data volumes comparable to production. A 500-row table and a 50-million-row table behave nothing alike.
- Monitoring access on the server side — you need to see why something got slow, not just that it did.
Organizational
- Developer cooperation on SSL pinning. Many production apps pin certificates specifically to defeat the man-in-the-middle proxying you're about to do. Ask for a debug build with pinning disabled. Bypassing it with third-party utilities works but is fragile and, on someone else's app, ethically and legally dubious.
- A transaction flow document. Write down each business journey as an ordered list of screens and the API calls behind them, before recording. It becomes your script structure, your review artifact, and your defense when someone asks what was actually tested.
Step 1: Build a load profile
Everything downstream depends on this. A load profile answers: which operations, at what intensity, for how long?
If you have production analytics:
- Find the busiest month in the last year.
- Within it, find the peak day by transaction volume.
- Within that day, find the peak hour.
- Rank operations by volume during that hour.
- Take the operations that make up 80%+ of total load — those are your script.
Then layer on two additional categories that volume alone won't surface:
- Resource-intensive operations. A report export run twelve times a day can still be the thing that takes the database down.
- Business-critical operations. Payment, checkout, and login belong in the profile regardless of what the numbers say.
If the app is new: build the profile from market analysis, comparable products, and marketing's launch projections. Then double it, because launch-day traffic is famously badly forecast.
Document the output as a table:
| Operation | Share of load | Target TPS | Response time SLA |
| Browse catalog | 45% | 120 | < 1.5s (95th) |
| Search | 22% | 60 | < 2.0s (95th) |
| Login | 15% | 40 | < 1.5s (95th) |
| Add to cart | 12% | 32 | < 1.0s (95th) |
| Checkout | 6% | 16 | < 3.0s (95th) |
Step 2: Choose a real device or emulator
Both work for recording. They differ in what they can exercise.
| Emulator / simulator | Real device | |
| Cost | Free or near-free | Hardware purchase per model |
| Setup speed | Minutes | Physical provisioning |
| Hardware features (GPS, camera, mic, NFC, biometrics) | Limited or stubbed | Full |
| Performance realism | Poor — runs on desktop-class CPU | Accurate |
| OS/vendor fragmentation coverage | Narrow | Broad, if you have the devices |
| Push notifications, deep links | Often unreliable | Reliable |
For pure protocol recording, an emulator is fine and cheaper — the HTTP traffic an emulator generates is identical to a real device's. Popular choices include Android Studio's AVD, Genymotion, and MEmu.
The moment your app touches GPS, camera, biometrics, or you care about anything client-side, you need real hardware. And since traffic patterns can genuinely differ by OS version — different TLS negotiation, different HTTP/2 support, different background fetch behavior — recording on at least one real device per major OS version is worth the effort.
Step 3: Put the device and desktop on the same network
JMeter's recorder is a proxy running on your machine. The device has to be able to reach it.
- Emulator: already on the host machine, so this is automatic.
- Real device: connect the phone to the same Wi-Fi network as your desktop (desktop can be on Wi-Fi or LAN, as long as it's the same router/subnet).
Find your machine's IPv4 address — ipconfig on Windows, ifconfig or ipconfig getifaddr en0 on macOS. Write it down; you'll enter it on the device in Step 6.
Two things that quietly break this: corporate networks with client isolation enabled (devices can't see each other), and host firewalls blocking the JMeter port. If the device can't reach the proxy, both are worth checking before you debug anything else.
Step 4: Install JMeter and configure the HTTP(S) Test Script Recorder
Launch JMeter's GUI. You'll see the test plan tree on the left and the configuration pane for the selected element on the right.
Build the recording skeleton in this order:
1. Add a Thread Group Right-click Test Plan → Add → Threads (Users) → Thread Group
This is the container for your virtual users. If you're scripting multiple journeys with different intensities, give each its own Thread Group — you'll need to scale them independently later.
2. Add a Recording Controller Right-click Thread Group → Add → Logic Controller → Recording Controller
Recorded requests land here. It's the destination, not the recorder itself.
3. Add a View Results Tree Right-click Test Plan → Add → Listener → View Results Tree
Essential for debugging. Turn it off before real load runs — it consumes enormous memory at scale.
4. Add the HTTP(S) Test Script Recorder Right-click Test Plan → Add → Non-Test Elements → HTTP(S) Test Script Recorder
Configure it:
- Port: 8888 (default). Whatever you choose here must match what you enter on the device.
- Target Controller: select Test Plan > Thread Group > Recording Controller. Miss this and your requests scatter into the tree root.
- Grouping: choose Put each group in a new transaction controller. This bundles the requests behind each user action into one named transaction, which makes results dramatically easier to read.
- URL Patterns to Exclude: add filters for static noise you don't want cluttering the script:
.*\.(bmp|css|js|gif|ico|jpe?g|png|svg|swf|woff2?|ttf)
.*\.(google-analytics|googletagmanager|crashlytics|firebase)\.com.*Then click Start. JMeter generates its root certificate and shows a confirmation dialog. Accept it, then stop the recorder for now.
The generated certificate is valid for seven days. When it expires, mid-project, recording silently breaks. Hit Start again to regenerate — and reinstall the new certificate on the device.
Step 5: Install the JMeter root certificate on the device
To read HTTPS traffic, the device must trust JMeter as a certificate authority. The file is ApacheJMeterTemporaryRootCA.crt, in JMeter's bin/ directory.
Getting the file onto the device:
- Real device: email it, use a cloud drive, or adb push it.
- Emulator: most emulators expose a shared folder between host and guest — copy the .crt there and open it from the device's file manager. adb push works too.
Android installation:
- Settings → Security → Encryption & credentials → Install a certificate → CA certificate (exact path varies by OEM and OS version)
- Locate the file in storage
- Name it something recognizable
- Confirm
- Set a screen lock PIN/password if prompted — Android requires one before it will store user certificates
⚠️ The Android 7+ gotcha that trips up most teams: since Android 7 (API 24), apps no longer trust user-installed CAs by default. Even with the certificate perfectly installed, HTTPS traffic from the app will fail. Your developers must ship a debug build with a network security configuration that permits it:
<!-- res/xml/network_security_config.xml -->
<network-security-config>
    <debug-overrides>
        <trust-anchors>
            <certificates src="system" />
            <certificates src="user" />
        </trust-anchors>
    </debug-overrides>
</network-security-config>iOS installation:
- Open the .crt — iOS downloads it as a configuration profile
- Settings → General → VPN & Device Management → install the profile
- Then, separately: Settings → General → About → Certificate Trust Settings and toggle full trust on
Step 3 is easy to miss. iOS will report the profile as installed while still refusing to trust it.
Step 6: Point the device's proxy at your machine
Android:
- Settings → Wi-Fi, long-press your network → Modify network
- Expand Advanced options
- Set Proxy to Manual
- Proxy hostname: your desktop's IPv4 address from Step 3
- Proxy port: 8888 (must match the recorder)
- Leave IP settings on DHCP
- Save
iOS: Settings → Wi-Fi → (i) next to your network → Configure Proxy → Manual → enter server and port.
Sanity-check it before recording: open a browser on the device and load any HTTPS site. If it loads and appears in View Results Tree, the chain is working. If the browser throws a certificate warning, revisit Step 5.
Step 7: Record the user journey
Click Start on the recorder, then drive the app on the device exactly as a user would.
Do:
- Follow your transaction flow document, in order
- Pause naturally between actions — this creates clean transaction boundaries
- Complete whole journeys, not fragments
- Record each major journey as a separate file, then merge later
Don't:
- Rush. Rapid tapping merges unrelated requests into a single transaction.
- Record background sync, analytics beacons, or push registration — exclude them or delete them after.
- Record once and assume it's complete. Record twice and diff the two; the differences are exactly the dynamic values you'll need to correlate.
Each action should produce a labeled transaction controller containing its underlying requests. When the journey is done, click Stop, then File → Save Test Plan As.
Afterward, turn the proxy off on the device (set it back to None). With the recorder stopped and the proxy still pointed at a dead port, the device simply loses internet access over Wi-Fi — a genuinely confusing five minutes if you've forgotten why. If you record frequently on a real device, note that toggling to cellular data and back preserves the Wi-Fi proxy settings, so you can flip between browsing and recording quickly.
Step 8: Clean up and correlate the script
A raw recording will not replay. This step is where mobile scripting actually lives, and it's where most of your time goes.
Correlation
Dynamic values — session tokens, CSRF tokens, JWTs, order IDs, cart IDs — were captured as hardcoded literals during recording. Replayed, they're stale and the server rejects them. You must extract each one from the response that produces it and inject it into every subsequent request that uses it.
JSON Extractor (for typical REST APIs):
Names of created variables: authToken
JSON Path expressions: $.data.access_token
Match No.: 1
Default Values: TOKEN_NOT_FOUND
Regular Expression Extractor (for anything non-JSON):
Name of created variable: sessionId
Regular Expression: "sessionId"\s*:\s*"([^"]+)"
Template: $1$
Match No.: 1
Default Value: SESSION_NOT_FOUND
Then replace the hardcoded value everywhere it appears with ${authToken}.
Set meaningful default values. When correlation fails, TOKEN_NOT_FOUND appearing in your logs is instantly diagnosable. A blank value produces a cascade of confusing downstream 401s.
Mobile apps are correlation-heavy — OAuth flows, refresh tokens, device IDs, and push tokens all chain together. Budget accordingly.
Parameterization
Every virtual user hitting the same account with the same search term isn't a load test; it's a cache-warming exercise. Feed real variety in with CSV Data Set Config:
Filename: /data/users.csv
Variable Names: username,password,searchTerm
Delimiter: ,
Recycle on EOF: False
Stop thread on EOF: True
Sharing mode: All threads
Reference as ${username}, ${password}, ${searchTerm}.
Timers
JMeter fires requests as fast as the server responds — no human does that. Without think time, you're testing a scenario that will never occur, and you'll overstate your capacity problem.
- Uniform Random Timer — a random delay in a window, best for general realism
- Gaussian Random Timer — normal distribution around a mean, closer to actual human behavior
- Constant Throughput Timer — pins the test to a target requests-per-minute, useful for hitting the exact TPS from your load profile
Assertions
A fast error is still an error, and JMeter counts HTTP 200 responses containing {"error": "service unavailable"} as successes unless you tell it otherwise.
- Response Assertion — check for expected text or absence of error strings
- JSON Assertion — validate response structure
- Duration Assertion — fail requests exceeding your SLA
- Size Assertion — catch truncated or empty payloads
Debug run
Run one thread, one iteration. Open View Results Tree and inspect every request and response manually. Fix everything before scaling up. A correlation bug at 1 user is a five-minute fix; at 2,000 users it's an afternoon of log archaeology.
Step 9: Design the load test plan
With a working script, build the test that will actually run.
Define user behavior profiles
Real user bases aren't homogeneous. Model the mix:
- Casual users — browse, view a few items, leave. Highest volume, lightest load.
- Engaged users — search, filter, add to cart, compare. Moderate volume, moderate load.
- Power users — heavy search, bulk actions, large uploads. Lowest volume, highest per-user cost.
Give each its own Thread Group with its own thread count and pacing, weighted to match production.
Configure thread groups
The standard Thread Group has three core settings:
- Number of threads — concurrent virtual users
- Ramp-up period — seconds to start them all. 100 users over 60 seconds means roughly 1.7 users/second. Never ramp instantly — you'll measure your own thundering-herd artifact rather than real behavior.
- Loop count — iterations per user, or set duration-based scheduling instead
For anything beyond a flat load, install the plugins and use:
- Ultimate Thread Group — arbitrary load shapes with independent ramp-up, hold, and ramp-down per stage. The right choice for most serious tests.
- Stepping Thread Group — adds users in fixed increments with holds between. Ideal for finding the exact breaking point.
- Concurrency Thread Group — maintains a target concurrency rather than a start rate.
Add logic controllers
- Transaction Controller — groups requests into a single measured business transaction. Non-negotiable for readable results.
- If Controller — conditional paths (e.g., only 30% of browsers proceed to checkout)
- Loop Controller — repeat a block, like scrolling through result pages
- Throughput Controller — send a defined percentage of users down a given path, which is how you implement your load profile percentages
- Once Only Controller — login and other setup that shouldn't repeat every iteration
Add HTTP Header Manager
Easy to forget, and mobile backends care. Your recording captured the app's real headers — keep them:
User-Agent: MyApp/4.2.1 (Android 14; SM-G991B)
Accept: application/json
X-Device-Id: ${deviceId}
X-App-Version: 4.2.1
Authorization: Bearer ${authToken}
Some backends route, rate-limit, or return different payloads based on User-Agent and app version. Replaying with JMeter's default headers can test a code path that no real user ever hits.
Add HTTP Cookie Manager and Cache Manager
Cookie Manager handles session cookies per thread. Cache Manager simulates client-side caching — set it to clear per iteration if you're modeling fresh app installs.
Step 10: Execute, throttle, and monitor
Run in non-GUI mode
The GUI is for building scripts, never for running load. It consumes memory and CPU that should be generating traffic and will distort your own results.
jmeter -n -t mobile-checkout.jmx \
-l results/run-01.jtl \
-e -o results/report-01 \
-Jthreads=500 \
-Jrampup=300 \
-Jduration=1800
- -n non-GUI
- -t test plan
- -l raw results file
- -e -o generate the HTML dashboard into a directory (must be empty)
- -J pass properties, referenced in the plan as ${__P(threads,100)}
Bump JMeter's heap in bin/jmeter / jmeter.bat for large runs:
HEAP="-Xms2g -Xmx4g -XX:MaxMetaspaceSize=512m"
Bandwidth throttling
This is what makes a mobile load test genuinely mobile. Your users are not on gigabit fiber, and payloads that feel fine on LAN behave completely differently at 3G speeds.
Set character-per-second limits in bin/user.properties:
# cps = (target bandwidth in kbps * 1024) / 8
httpclient.socket.http.cps=15360
httpclient.socket.https.cps=15360
Common reference values:
| Network | Approx. bandwidth | cps value |
| GPRS | 40 kbps | 5,120 |
| 3G | 120 kbps | 15,360 |
| 4G / LTE | 1,024 kbps | 131,072 |
| 5G | 10,240 kbps | 1,310,720 |
| Wi-Fi | 30,720 kbps | 3,932,160 |
Run your critical journeys at 3G and 4G, not just unthrottled. The gap between them is often where your payload-size problem announces itself.
Monitor everything, on both sides
Client-side listeners (use sparingly — they cost memory):
- Aggregate Report
- Summary Report
- Transactions per Second
- Active Threads Over Time
- Response Times Over Time
- Hits per Second
Server-side (this is where root causes live):
- PerfMon Metrics Collector plugin with ServerAgent on your app servers — CPU, memory, disk, network
- Grafana + InfluxDB/Prometheus via JMeter's Backend Listener for live dashboards
- APM tooling — Dynatrace, AppDynamics, New Relic, Datadog — for transaction tracing down to the slow SQL statement
A test that shows "response time degraded at 400 users" is a finding. A test that shows "response time degraded at 400 users because the DB connection pool capped at 50 and requests queued" is a fix.
Step 11: Analyze results and write the report
Generate the HTML dashboard with -e -o, then read it in this order:
- Error rate first. If errors climbed under load, your response time numbers are measuring failure paths and are meaningless until you fix the errors.
- Percentiles, not averages. The 95th and 99th are your user experience.
- Response time over time, overlaid with active threads. Where does the curve bend? That inflection point is your capacity limit.
- Throughput plateau. When throughput flattens while threads keep climbing, the system is saturated. That's your ceiling.
- Correlate with server metrics. Match the bend in the response curve to the resource that maxed out — CPU, memory, connections, I/O.
Reporting that gets acted on
A dashboard dump isn't a report. Structure it:
- Executive summary — did we meet the SLAs, yes or no, and what's the business risk
- Test configuration — build version, environment, load profile, duration, throttling settings, data set
- Results vs. targets — a table of each transaction against its SLA, pass/fail
- Bottlenecks identified — with supporting evidence from server-side monitoring
- Recommendations — prioritized by impact and effort
- Appendix — full graphs, raw configuration, reproducibility notes
Version the report alongside the build. Trend data across releases is far more valuable than any single run, because it catches gradual regressions that individual tests always pass.
Common challenges and how to solve them
| Challenge | Why it's hard on mobile | Approach |
| Device fragmentation | Thousands of device/OS/OEM combinations, each with different behavior | Emulators for protocol recording; a real-device cloud for coverage across actual hardware |
| Network variability | Users span 3G to 5G, with handoffs, dead zones, and packet loss | JMeter cps throttling for server-side; Network Link Conditioner or device-level shaping for client-side |
| SSL pinning | Pinning exists specifically to prevent proxy interception | Request a debug build with pinning disabled — the correct path, and far more stable than bypass tools |
| Session and token handling | OAuth flows, refresh tokens, device IDs all chain together | Systematic correlation with extractors; treat token refresh as its own scripted flow |
| Android 7+ CA trust | User CAs untrusted by default since API 24 | network_security_config.xml with debug overrides |
| Battery and resource drain | JMeter can't see it; heavy scripts don't mimic real usage anyway | Device-level profiling on real hardware, in parallel with load |
| Background/foreground transitions | Apps suspend, resume, and re-authenticate; protocol tests never see this | Real-device functional and performance testing |
| Test data exhaustion | Long runs burn through accounts, coupons, and inventory | Sized CSV data sets, Stop thread on EOF, and a reset routine between runs |
| Third-party dependencies | Payment gateways and analytics SDKs rate-limit you, not the other way round | Service virtualization or sandbox endpoints; never load-test someone else's production |
Testing real-time apps with JMeter
Chat, trading, multiplayer gaming, live sports, and IoT dashboards have a different profile: persistent connections, low latency tolerance, and very high concurrency.
JMeter can handle a meaningful portion of this with plugins:
- WebSocket Samplers by Peter Doornbosch — open, send, receive, and close WebSocket connections as distinct samplers, which lets you model realistic conversation patterns rather than just connection counts
- MQTT plugin (XMeter) — publish/subscribe testing for IoT
- gRPC plugin — increasingly relevant as mobile backends adopt gRPC
What to measure: connection establishment time, message round-trip latency, sustained concurrent connections before degradation, message loss, server memory per connection, and reconnection behavior after a network drop.
The caveats are real. Each JMeter thread holds an OS-level socket, so concurrency ceilings arrive much sooner than with stateless HTTP — plan for distributed load generation. Proprietary protocols (Firebase Realtime Database, custom binary formats) may have no plugin at all. And JMeter measures server latency; the actual perceived latency on a device, including client-side processing, needs device-level measurement.
JMeter vs. LoadRunner for mobile
Both are legitimate choices, and many enterprises run both. The comparison:
| Dimension | Apache JMeter | OpenText LoadRunner |
| Licensing | Free, open source | Commercial, per-VU |
| Mobile recording | HTTP(S) Test Script Recorder via proxy | Web HTTP/HTML protocol, plus TruClient for browser-level |
| Correlation | Manual — extractors you write | Auto-correlation with manual refinement |
| Scripting | GUI + Groovy/JSR223 | C-based VuGen scripting |
| Learning curve | Moderate; large community and free material | Steeper; formal training typical |
| Protocol breadth | Broad via plugins | Very broad natively, including legacy enterprise protocols |
| Analysis | HTML dashboard, Grafana integration | Rich built-in Analysis module |
| CI/CD | Native CLI, trivially scriptable | Supported, more setup |
| Scaling cost | Infrastructure only | Infrastructure + per-VU licensing |
| Best fit | Most teams; anyone scaling test frequency | Large enterprises with legacy protocols and existing investment |
Practically: JMeter's per-VU cost of zero means you can run performance tests on every build, which usually matters more than any single feature difference. LoadRunner earns its license where you need protocols JMeter lacks, or where auto-correlation meaningfully reduces effort on very complex enterprise applications. LoadRunner's TruClient protocol also captures browser-level rendering that JMeter's protocol approach can't — though for mobile apps, that gap is better closed with real-device testing than with either tool.
Choosing your load generation infrastructure
| Local machines | Self-managed cloud | Managed load platform | |
| Setup | Minimal | Provisioning + config | Preconfigured |
| Max realistic load | Low — a few hundred VUs | High | Very high |
| Distributed testing | Complex manual setup | Manual, needs expertise | Built in |
| Geographic distribution | None | Possible, more work | Built in |
| Maintenance burden | High | Medium | Low |
| Cost profile | Free but capped | Variable, can escalate | Subscription |
| Best for | Development and debugging | Teams with cloud expertise | Teams prioritizing speed over control |
Local is right for script development, debugging, and small smoke tests in CI. It will not generate serious load — the client machine becomes the bottleneck long before your server does, and you'll spend hours chasing a problem that's in your own laptop.
Self-managed cloud (JMeter master + slaves on EC2, or containerized on Kubernetes) gives you real scale and control, at the price of managing it. Watch your egress and instance costs; unmonitored cloud load testing has an unfortunate habit of generating memorable invoices.
Managed platforms trade control for speed and remove distributed-test plumbing entirely.
Whichever you choose, always monitor the load generator itself. If JMeter's own CPU is pegged at 100%, your response time measurements include your client's queuing delay and are simply wrong.
Where JMeter stops and real-device testing starts
This is the section most JMeter guides skip, and it's the one that determines whether your performance program actually reflects user experience.
JMeter has now told you your backend handles 5,000 concurrent users with a 95th percentile of 1.2 seconds. Genuinely valuable. But consider what a user on a two-year-old Android device actually experiences:
- The app takes 4.5 seconds to cold start because of synchronous initialization on the main thread
- Memory climbs to 380MB on a product listing screen, and the OS kills the app when they switch to their messaging app and back
- Scrolling drops to 22fps because images are decoded on the UI thread
- The device thermally throttles after eight minutes of use, and everything slows down
- Battery drops 8% in fifteen minutes, and they uninstall
Every single one of those APIs returned in under 1.2 seconds. JMeter's report is accurate and the user experience is terrible, because JMeter measured the network and the user experienced the device.
The complete picture requires both layers:
| Layer | Question answered | Tool |
| Protocol / server | Does the backend scale? | JMeter |
| Device / client | Is the app fast on real hardware? | Real-device testing |
This is where a real-device platform like Kobiton completes the picture. Running your app on actual devices a range of them, including the low-end and older models a meaningful share of your users are on surfaces app launch time, CPU and memory profiles, network payload behavior, battery impact, and rendering performance that no protocol-level tool can see. Kobiton captures these metrics automatically during sessions and flags regressions against previous builds.
A practical combined workflow:
- JMeter in CI on every build — a short, focused API load test as a quality gate on backend regressions
- Real-device performance runs on every release candidate — launch time, memory, CPU, battery, rendering across a representative device matrix
- Full-scale JMeter load tests before major releases — peak-load and stress scenarios against a production-like environment
- Real-device testing under representative network conditions — because a 200ms API on 4G behaves very differently from the same API on 3G with 5% packet loss
- Trend both over time — regressions creep in gradually, and any single test in isolation will pass
Neither layer substitutes for the other. Teams that only run JMeter ship apps with fast APIs and slow experiences. Teams that only run device tests get blindsided on launch day when the backend folds.
Pre-flight checklist
Before scripting
- [ ] Load profile documented with target TPS and SLAs per operation
- [ ] Transaction flows written down
- [ ] Test environment sized comparably to production
- [ ] Production-like data volumes loaded
- [ ] Server-side monitoring in place and verified
- [ ] SSL pinning disabled in the debug build
- [ ] Test data sets prepared and sized for full run duration
Before running
- [ ] Script debugged at 1 user, 1 iteration, every response manually verified
- [ ] All dynamic values correlated, with meaningful default values
- [ ] Parameterization confirmed — no two users sending identical inputs
- [ ] Think times added and realistic
- [ ] Assertions validate content, not just HTTP status
- [ ] Ramp-up gradual, not instant
- [ ] Non-GUI mode, GUI listeners disabled
- [ ] JVM heap sized for the thread count
- [ ] Bandwidth throttling configured for target network conditions
- [ ] Load generator capacity confirmed adequate
After running
- [ ] Error rate checked before anything else
- [ ] Percentiles reported, not just averages
- [ ] Response time correlated with server-side resource metrics
- [ ] Bottleneck identified with evidence, not inferred
- [ ] Results compared against previous release
- [ ] Report written with prioritized recommendations
- [ ] Client-side device performance validated separately
FAQ
Can JMeter test a native mobile app directly?
Not the app itself. JMeter tests the HTTP/HTTPS traffic between the app and its backend by acting as a recording proxy. It never installs, launches, or interacts with the app's UI. For app-level performance, you need device-level testing.
Do I need real devices, or are emulators enough?
Emulators are fine for recording protocol traffic — the HTTP requests are identical. They're inadequate for anything measuring actual device performance, since an emulator runs on desktop-class hardware and tells you nothing about a mid-range phone.
Why does my recording capture nothing over HTTPS?
In order of likelihood: the certificate isn't installed correctly; on Android 7+, the app doesn't trust user CAs (needs network_security_config.xml); the app uses certificate pinning; the certificate expired after seven days; or the proxy port doesn't match between device and recorder.
How many virtual users should I simulate?
Derive it from your load profile — peak hour concurrent users, plus headroom (typically 20–50%) for growth and traffic spikes. Concurrent users is not registered users; a 100,000-user app might peak at 2,000 concurrent.
What's a good response time target?
It depends on the interaction. Roughly: under 100ms feels instantaneous; under 1 second keeps flow uninterrupted; under 3 seconds is tolerable with feedback; beyond 5 seconds, users leave. Set targets per transaction based on user expectation, and measure at the 95th percentile.
Can I run JMeter tests in CI/CD?
Yes — non-GUI mode is designed for it. Run a focused, short test on every build with pass/fail thresholds as a gate, and reserve full-scale load tests for release candidates.
Does JMeter measure battery or memory usage?
No. JMeter operates at the protocol layer and has no visibility into the device. Battery, memory, CPU, and rendering metrics require running the app on real hardware with device-level profiling.
How often should we run performance tests?
Short API tests on every build in CI; comprehensive load tests on every release candidate; full stress and endurance tests before major releases or anticipated traffic events. Real-device performance checks should follow the same release-candidate cadence.
Bringing it together
JMeter is the right tool for a specific, important job: proving your backend holds up when traffic arrives. Used well — with a load profile grounded in real data, careful correlation, realistic think times, bandwidth throttling, and server-side monitoring — it gives you a defensible answer to "will this scale?"
What it will never tell you is whether the app feels fast in someone's hand on a crowded train. That answer lives on real devices, under real network conditions, on the hardware your users actually own.
Run both. Trend both across releases. The teams that ship consistently fast mobile experiences aren't the ones with the best load testing tool — they're the ones who stopped treating server performance and device performance as the same question.
