
In mobile QA, simply running tests is not enough. The true value lies in how you interpret mobile test execution data to guide decisions on release readiness, speed, and stability. Without meaningful metrics, teams often rely on incomplete dashboards that show activity but fail to provide insights into actual quality outcomes.
This guide breaks down the key mobile test execution metrics that help QA teams make informed decisions, reduce uncertainty, and improve testing efficiency in real device environments.
Understanding Mobile Test Execution in the QA Context
Mobile test execution refers to the process of running planned test cases on real or virtual devices to validate app behavior across different OS versions, screen sizes, networks, and hardware conditions.
In modern CI/CD pipelines, test execution happens continuously, not just at the end of a sprint. As a result, execution metrics play a crucial role in release readiness decisions, providing much more than simple activity reporting.
Why Mobile Test Execution Metrics Matter
Tracking execution without meaningful metrics often leads to:
- Blind spots in device coverage
- Delayed detection of critical defects
- Unclear signals about release readiness
- Inefficient use of device lab resources
Well-chosen metrics help QA teams answer important questions like:
- Are we testing enough of the app across various devices?
- Is execution speed affecting release timelines?
- Are we catching issues early or too late in the cycle?
- Is automation really reducing manual testing efforts?
Core Mobile Test Execution Metrics to Track
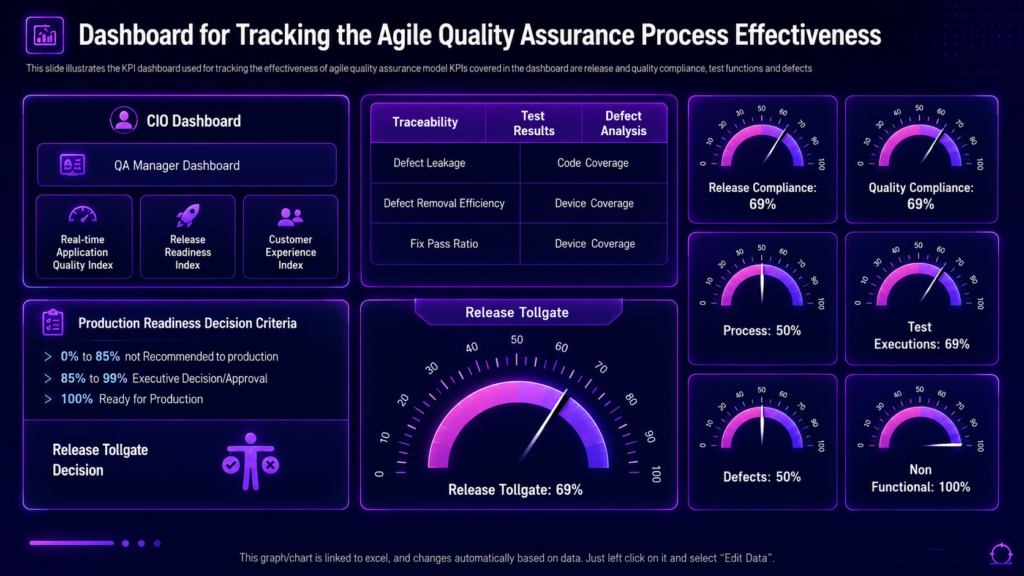
Below are the most practical and decision-driving metrics that mobile QA teams should monitor.
1. Test Case Execution Rate
This metric shows how much of the planned testing has been completed.
Formula:
(Executed test cases ÷ Planned test cases) × 100
A low execution rate could indicate:
- Device availability bottlenecks
- Unstable builds blocking testing
- Under-resourced QA cycles
A high rate shows progress, but it should always be considered alongside defect insights.
2. Test Execution Time
This tracks how long it takes to complete a test suite across devices.
Impact:
- CI/CD feedback speed
- Release frequency
- Developer turnaround time
Long execution times often indicate:
- Slow device provisioning
- High manual testing reliance
- Inefficient automation scripts
3. Pass/Fail Rate
This metric indicates the health of the current build.
Formula:
(Passed tests ÷ Total executed tests) × 100
Key interpretation:
- High pass rate → stable build (but verify test quality)
- Sudden drop → possible regression or environment issue
Tracking a stable pass rate trend is more valuable than a one-time snapshot.
4. Flaky Test Rate
Flaky tests yield inconsistent results without any code changes.
Formula:
(Flaky tests ÷ Total tests) × 100
Why this matters:
- Reduces trust in automation
- Causes false alarms in CI/CD
- Slows down release decisions
Keeping this low boosts confidence in automation pipelines.
5. Device Coverage During Execution
This tracks how many real devices are used during test execution.
It helps answer questions like:
- Are we testing across enough Android/iOS versions?
- Are low-end devices included in execution cycles?
- Is device allocation balanced?
Low coverage can hide real-world performance issues.
6. Defect Detection Rate During Execution
This measures how many defects are found during test runs.
It provides insights into:
- Test effectiveness
- Weak areas in test design
- Risk-prone app modules
Higher early detection reduces production defects and improves release confidence.
7. Defect Leakage (Escaped Defects)
This tracks bugs found after release that should have been detected earlier.
Formula:
Defects found in production ÷ Total defects
This metric is one of the strongest indicators of QA effectiveness. A lower defect leakage rate signifies a stronger execution strategy.
8. Automation Execution Ratio
This shows the percentage of testing that is automated.
Formula:
(Automated executions ÷ Total executions) × 100
This metric helps teams:
- Reduce manual regression workload
- Speed up CI/CD pipelines
- Scale across multiple devices
However, automation must remain reliable and stable to be effective.
9. Test Environment Stability
This tracks failures caused by environment issues rather than app defects.
Examples include:
- Device cloud downtime
- Network inconsistencies
- App installation failures
High instability means execution results may not be reliable.
10. Execution Throughput per Cycle
This measures how many tests are executed per sprint or release cycle.
It is essential for:
- Capacity planning
- Predicting release timelines
- Balancing QA workload
An increase in throughput often signals improved QA maturity and efficiency.
How These Metrics Support QA Decision-Making
When combined, these metrics help QA teams:
- Make data-driven release readiness decisions
- Identify bottlenecks in device or automation pipelines
- Improve regression strategies over time
- Prioritize high-risk test areas
- Reduce production defects
Execution metrics are most effective when tracked over time, rather than in isolation.
Common Mistakes Teams Make
Many QA teams struggle not because they lack data, but because they track the wrong signals:
- Focusing only on pass/fail rates
- Ignoring flaky test behavior
- Overloading dashboards with vanity metrics
- Not segmenting metrics by device type
- Tracking execution but not defect outcomes
The goal is not to track more metrics but to focus on the most useful ones.
Final Thoughts
Mobile test execution metrics turn raw testing activity into actionable QA intelligence. When properly tracked, they help teams move from reactive testing to proactive quality control, improving app performance and stability under real user conditions. By focusing on the right metrics, QA teams can make better, faster decisions and deliver higher-quality mobile experiences.