
Sep 12, 2020
Best Gets Better: ITA September 2020 Updates

Adam Creamer
Read More
Our latest Kobiton platform release brings a whole lot of exciting updates to the table, including a brand new Session Explorer in Kobiton DLM, the ability to use ITA on Private Devices, Open Appium export, and much more. For more information on how these updates work to make your mobile experience better, keep on reading!
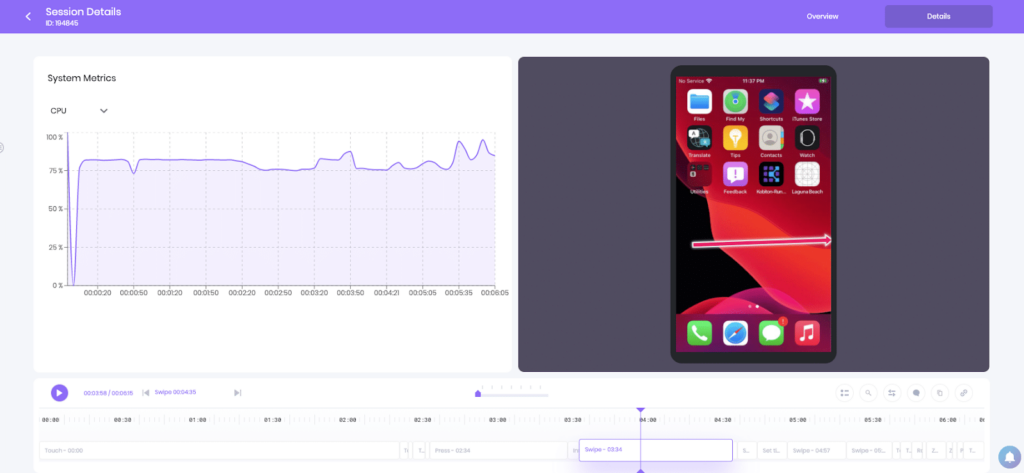
If you’re testing mobile applications, you almost certainly know what it’s like spending hours trying to pinpoint exactly where application crashes and failures begin during your test session–and this applies to teams that are performing manual tests, exploratory tests, and automation tests. The traditional (AKA old and outdated as of now) way was to run through your session, take screenshot after screenshot, and then repeat test sessions over and over again to find specific points of failure. If that sounds headache-inducing…that’s because it is.
In our latest release, we unveiled our solution to “screenshot after screenshot,” and it’s changing the game for any mobile testing team who cares to know exactly what failed, when, and why. No matter what kind of mobile testing that you’re running through Kobiton, our new Session Explorer allows you to pinpoint exactly when your application starts to fail.
CHECK OUT THE SESSION EXPLORER BLOG
Mobile testing teams have to manage more than just applications and devices. Especially as teams grow larger, the ability to manage and onboard users within your testing platform becomes crucial.
To meet this need, we have added additional Org Management capabilities via our API. As of this latest release, you can now more easily assign, remove, reactivate, and assign roles to users–making the management of your Kobiton platform as easy as possible.
Mobile testing teams need access to devices running the newest Apple (iOS 14) and Android (Android 11) operating systems. As always, we keep you and your teams up to date with support for both of these operating systems in our Public Cloud. So, test away and get your applications ready for customers who are updating to the newest OS.
If you haven’t already heard about Kobiton’s Intelligent Test Automation engine (ITA, for short), you’ve been missing out on the industry’s best test automation for mobile and the only solution that lets you go full Appium without writing any code. You can learn more by watching the video below and visiting the webpage, but, in-short, ITA watches in the background as you perform a manual test, and then it is able to convert that manual session into an automated test case that you can direct to run across your library of real iOS and Android devices. Yes, you read that right: Write once. Run everywhere.
Watch the automated testing video here.
LEARN MORE: READ THE ITA UPDATE BLOG
In our latest 9/21 release, we added several key new features to ITA. You can read the ITA-specific blog (linked above) for in-depth information, but here’s a quick recap:
We are really excited about what these updates bring to you and your teams, and we hope that you’ve enjoyed this product update. For more technical information concerning how to use these new features, make sure to check out our support portal, and please do let us know what you think!

